- Home
- /
- Programming
- /
- Graphics
- /
- Re: GMAP trouble with census shape files
- RSS Feed
- Mark Topic as New
- Mark Topic as Read
- Float this Topic for Current User
- Bookmark
- Subscribe
- Mute
- Printer Friendly Page

- Mark as New
- Bookmark
- Subscribe
- Mute
- RSS Feed
- Permalink
- Report Inappropriate Content
I am working with the American Indian/Alaska Native/Native Hawaiian Area shape files, specifically looking at the South Dakota tribal regions. I am having a difficult time getting a US (or SD when looking at a subset) outline to overlay properly. I am creating an annotate data set from the maps.states to use as my outline. Any thoughts?
These are the South Dakota tribal areas that I have projected and mapped.
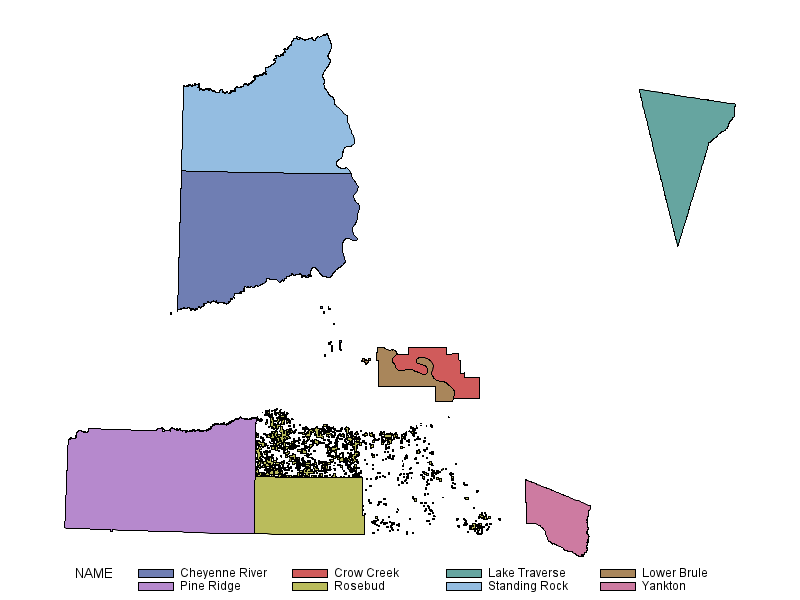
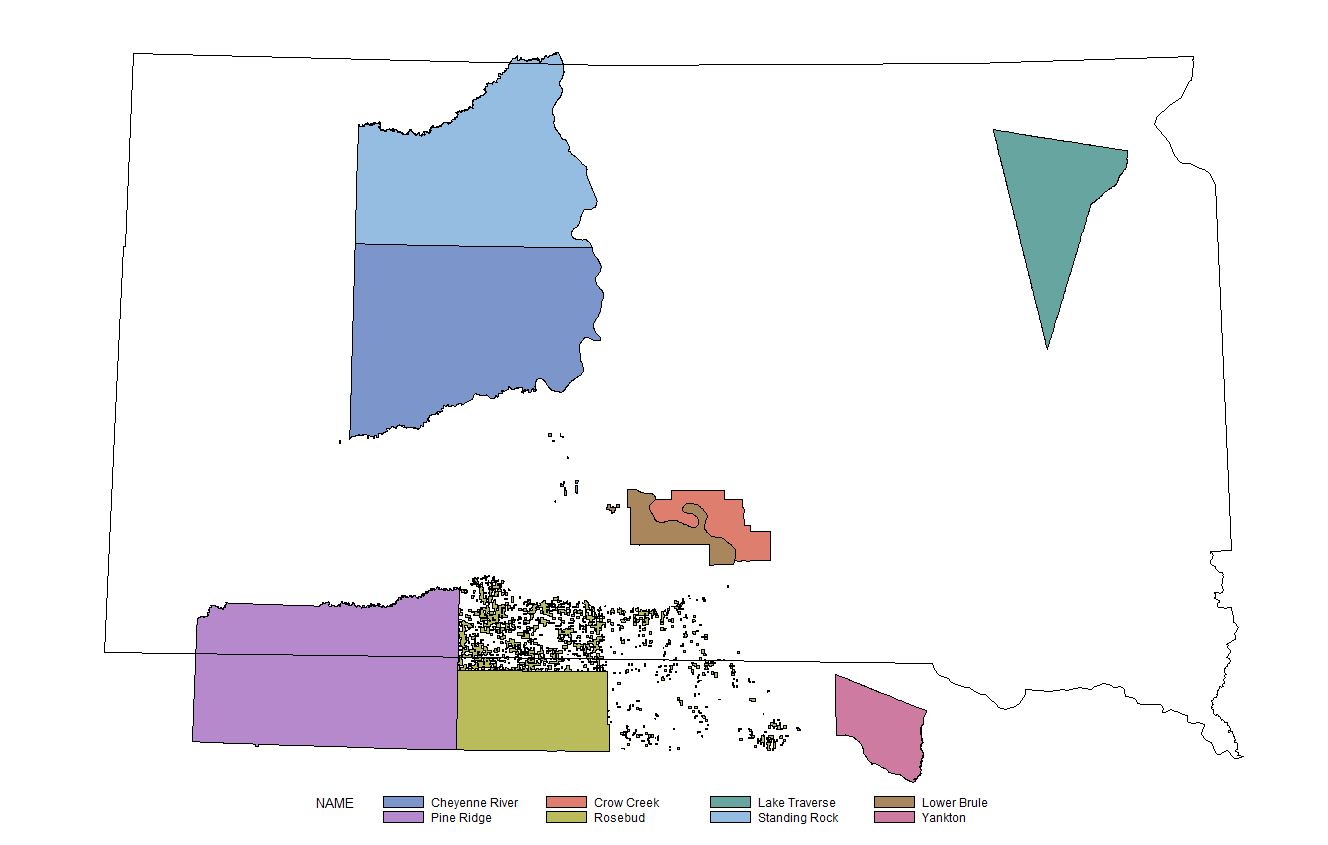
Here is the failed overlay:
Accepted Solutions

- Mark as New
- Bookmark
- Subscribe
- Mute
- RSS Feed
- Permalink
- Report Inappropriate Content
It's difficult to say, without seeing your code, and seeing what your imported shape files look like.
For the map to come out looking correct, you will need to make sure that both your state map and your imported boundary files have consistent X/Ys ... for example, since maps.states has the long/lat X/Ys in radians, you would want to convert your imported shape file to radians (if they are in degrees, or other), and you want to make sure the longitude (X) value is in 'westlong' (for the US, that would be a positive value, rather than negative). You'll then want to combine the maps, and gproject them together.
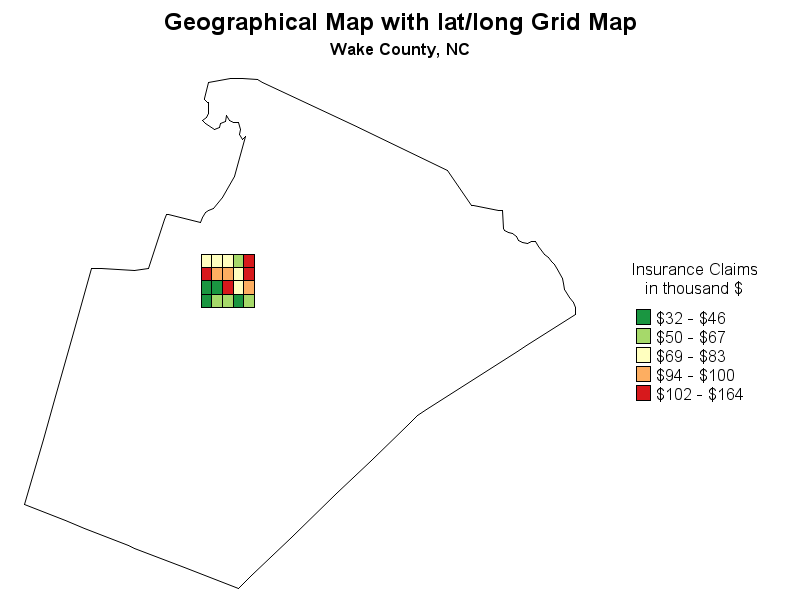
Here is the closest example I have to what you're doing (I'm using maps.counties, rather than maps.states ... and I'm combining the map with some rectangular areas):
http://robslink.com/SAS/democd49/grid_map_info.htm
- Mark as New
- Bookmark
- Subscribe
- Mute
- RSS Feed
- Permalink
- Report Inappropriate Content
It's difficult to say, without seeing your code, and seeing what your imported shape files look like.
For the map to come out looking correct, you will need to make sure that both your state map and your imported boundary files have consistent X/Ys ... for example, since maps.states has the long/lat X/Ys in radians, you would want to convert your imported shape file to radians (if they are in degrees, or other), and you want to make sure the longitude (X) value is in 'westlong' (for the US, that would be a positive value, rather than negative). You'll then want to combine the maps, and gproject them together.
Here is the closest example I have to what you're doing (I'm using maps.counties, rather than maps.states ... and I'm combining the map with some rectangular areas):
http://robslink.com/SAS/democd49/grid_map_info.htm
- Mark as New
- Bookmark
- Subscribe
- Mute
- RSS Feed
- Permalink
- Report Inappropriate Content
Got it! Thanks!

Don't miss out on SAS Innovate - Register now for the FREE Livestream!
Can't make it to Vegas? No problem! Watch our general sessions LIVE or on-demand starting April 17th. Hear from SAS execs, best-selling author Adam Grant, Hot Ones host Sean Evans, top tech journalist Kara Swisher, AI expert Cassie Kozyrkov, and the mind-blowing dance crew iLuminate! Plus, get access to over 20 breakout sessions.
Learn how use the CAT functions in SAS to join values from multiple variables into a single value.

Find more tutorials on the SAS Users YouTube channel.
 Click image to register for webinar
Classroom Training Available!
Select SAS Training centers are offering in-person courses. View upcoming courses for:
-
2 replies
-
07-10-2013 03:12 PM
-
956 views
-
0 likes
-
2 in conversation
-
