- Home
- /
- Programming
- /
- Graphics
- /
- Displaying Three Columns of Data in a Line Graph in SAS 9.2
- RSS Feed
- Mark Topic as New
- Mark Topic as Read
- Float this Topic for Current User
- Bookmark
- Subscribe
- Mute
- Printer Friendly Page

- Mark as New
- Bookmark
- Subscribe
- Mute
- RSS Feed
- Permalink
- Report Inappropriate Content
I have a dataset with three types of columns that is similar to the below example. I want to display the three columns as three lines in a line graph with tooltips and display the line graph inside a portlet of Information Delivery Portal using SAS 9.2. I’m not attached to the example I’m just posting it as a reference point. What SAS method should I use to display the line graph?
data sample;
do Xvar=1 to 10;
Yvar1=round(ranuni(0)*(30));
Yvar2=round(ranuni(0)*(70-40))+40;
Yvar3=round(ranuni(0)*(100-70))+70;
output;
end;
run;
/* Define the title */
title1 "Use Solid-Filled Symbols with PROC GPLOT";
/* Define symbol characteristics */
symbol1 interpol=join /*value=squarefilled*/ color=vibg height=2;
symbol2 interpol=join /*value=trianglefilled*/ color=depk height=2;
symbol3 interpol=join /*value=diamondfilled*/ color=mob height=2;
/* Define legend characteristics */
legend1 label=none frame;
/* Define axis characteristics */
axis1 label=("X Variable") minor=none offset=(1,1);
axis2 label=(angle=90 "Y Variable")
order=(0 to 100 by 10) minor=(n=1);
proc gplot data=sample;
plot (yvar1 yvar2 yvar3)*xvar / overlay legend=legend1
haxis=axis1 vaxis=axis2;
run;
Accepted Solutions
- Mark as New
- Bookmark
- Subscribe
- Mute
- RSS Feed
- Permalink
- Report Inappropriate Content
This combines the data into one column.
data sample;
do Xvar=1 to 10;
Yvar1=round(ranuni(0)*(30));
Yvar2=round(ranuni(0)*(70-40))+40;
Yvar3=round(ranuni(0)*(100-70))+70;
output;
end;
run;
proc print data= sample;
run;
proc summary data= sample;
var Yvar1;
output out = Yvar1Set sum = Yvar1;
run;
proc summary data= sample;
var Yvar2;
output out = Yvar2Set sum = Yvar2;
run;
proc summary data= sample;
var Yvar3;
output out = Yvar3Set sum = Yvar3;
run;
data Yvar1Set; set Yvar1Set (rename = (Yvar1 = mergedColumn)); length columnDisplay $20; columnDisplay = "firstSet"; run;
data Yvar2Set; set Yvar2Set (rename = (Yvar2 = mergedColumn)); length columnDisplay $20; columnDisplay = "secondSet"; run;
data Yvar3Set; set Yvar3Set (rename = (Yvar3 = mergedColumn)); length columnDisplay $20; columnDisplay = "thirdSet"; run;
data combined (keep = mergedColumn columnDisplay); set Yvar1Set Yvar2Set Yvar3Set; run;
proc print data=combined;
run;
- Mark as New
- Bookmark
- Subscribe
- Mute
- RSS Feed
- Permalink
- Report Inappropriate Content
If there is not a way to display the data directly is there a good way to reformat the data so that it is in one column? Then I could index the column for tooltips.
- Mark as New
- Bookmark
- Subscribe
- Mute
- RSS Feed
- Permalink
- Report Inappropriate Content
This combines the data into one column.
data sample;
do Xvar=1 to 10;
Yvar1=round(ranuni(0)*(30));
Yvar2=round(ranuni(0)*(70-40))+40;
Yvar3=round(ranuni(0)*(100-70))+70;
output;
end;
run;
proc print data= sample;
run;
proc summary data= sample;
var Yvar1;
output out = Yvar1Set sum = Yvar1;
run;
proc summary data= sample;
var Yvar2;
output out = Yvar2Set sum = Yvar2;
run;
proc summary data= sample;
var Yvar3;
output out = Yvar3Set sum = Yvar3;
run;
data Yvar1Set; set Yvar1Set (rename = (Yvar1 = mergedColumn)); length columnDisplay $20; columnDisplay = "firstSet"; run;
data Yvar2Set; set Yvar2Set (rename = (Yvar2 = mergedColumn)); length columnDisplay $20; columnDisplay = "secondSet"; run;
data Yvar3Set; set Yvar3Set (rename = (Yvar3 = mergedColumn)); length columnDisplay $20; columnDisplay = "thirdSet"; run;
data combined (keep = mergedColumn columnDisplay); set Yvar1Set Yvar2Set Yvar3Set; run;
proc print data=combined;
run;

- Mark as New
- Bookmark
- Subscribe
- Mute
- RSS Feed
- Permalink
- Report Inappropriate Content
For most line plots I would tend to create a variable that indicates which series or group of data it belongs to instead of overlay.
data sample;
do Xvar=1 to 10;
Group = 1;
Yval=round(ranuni(0)*(30));
output;
group = 2;
Yval=round(ranuni(0)*(70-40))+40;
output;
group = 3;
Yval=round(ranuni(0)*(100-70))+70;
output;
end;
run;
and display with
proc gplot data=sample;
plot yval*xvar = group / legend=legend1
haxis=axis1 vaxis=axis2;
run;
quit;
Or same data and use group = option with SGPlot though Axis controls with 9.2 aren't quite as flexible as the traditional SAS/Graph.
- Mark as New
- Bookmark
- Subscribe
- Mute
- RSS Feed
- Permalink
- Report Inappropriate Content
When I run that on 9.2 it creates the below unusable graph, without tooltips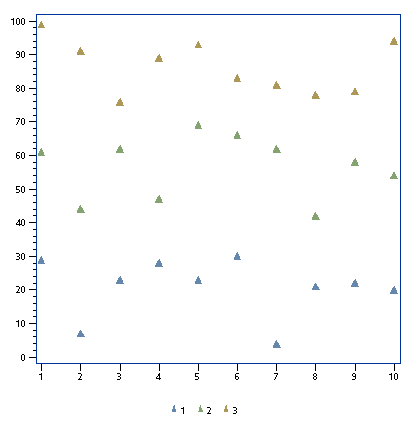 :
:
- Mark as New
- Bookmark
- Subscribe
- Mute
- RSS Feed
- Permalink
- Report Inappropriate Content
Since I don't see any lines then you didn't use your symbol statements. Tool tips I leave to others as I don't use them.
The reason I use an approach with assigning a categorical variable to define the data types is that it is way more manageable when more than 2 or 3 groups are around. Also if I discover than one series is dominating the data it is easy to plot by using a dataset option to exclude that series or two.

Don't miss out on SAS Innovate - Register now for the FREE Livestream!
Can't make it to Vegas? No problem! Watch our general sessions LIVE or on-demand starting April 17th. Hear from SAS execs, best-selling author Adam Grant, Hot Ones host Sean Evans, top tech journalist Kara Swisher, AI expert Cassie Kozyrkov, and the mind-blowing dance crew iLuminate! Plus, get access to over 20 breakout sessions.
Learn how use the CAT functions in SAS to join values from multiple variables into a single value.

Find more tutorials on the SAS Users YouTube channel.
 Click image to register for webinar
Classroom Training Available!
Select SAS Training centers are offering in-person courses. View upcoming courses for:
-
5 replies
-
07-28-2015 01:42 PM
-
1190 views
-
0 likes
-
2 in conversation
-
