- Home
- /
- Programming
- /
- Graphics
- /
- Dates getting changed between data and graph?
- RSS Feed
- Mark Topic as New
- Mark Topic as Read
- Float this Topic for Current User
- Bookmark
- Subscribe
- Mute
- Printer Friendly Page

- Mark as New
- Bookmark
- Subscribe
- Mute
- RSS Feed
- Permalink
- Report Inappropriate Content
Hi everyone-
I'm having issues with my date values changing when I run a proc gplot or gchart.
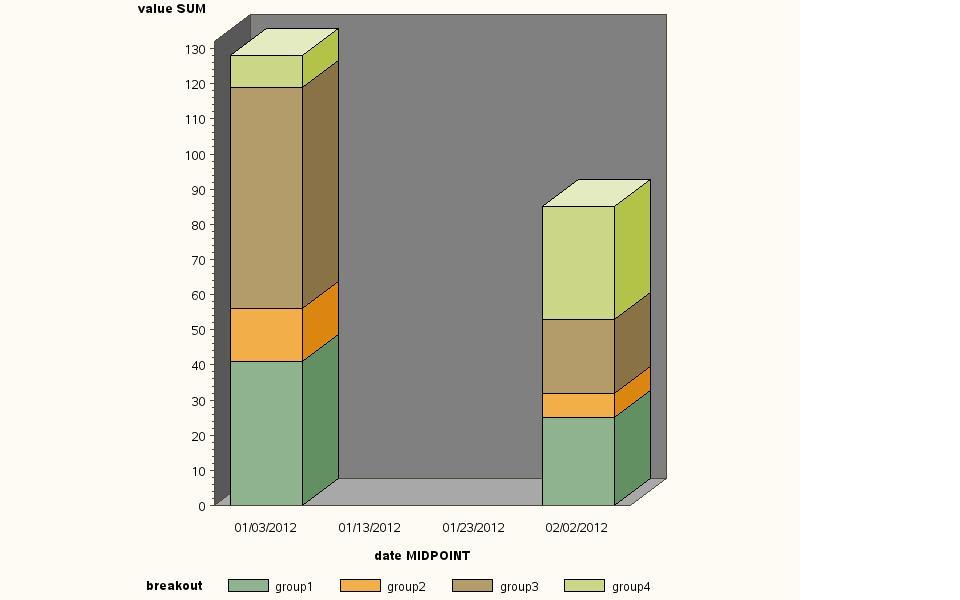
Here is a simple example with output I dervied that illustrates the problem. My dates are only 1/1/2012 and 2/1/2012, yet when I graph it 1/3/2012, 1/13/2012, 1/23/2012, and 2/2/2012. Does anyone know why this is happening? I only want two dates showing, the only two in the data set 1/1/2012 and 2/1/2012 and ideally in the mmyyd7. format.
thank you!
data t2;
format breakout $15. ;
input breakout $ value date:mmddyy10.;
datalines;
group1 41 1/1/2012
group1 25 2/1/2012
group2 15 1/1/2012
group2 7 2/1/2012
group3 63 1/1/2012
group3 21 2/1/2012
group4 9 1/1/2012
group4 32 2/1/2012
;
run;
proc gchart data=t2;
format date mmddyy10.;
vbar3d date /sumvar=value subgroup=breakout
width=9
space=4
cframe=gray;
run;
quit;
Accepted Solutions

- Mark as New
- Bookmark
- Subscribe
- Mute
- RSS Feed
- Permalink
- Report Inappropriate Content
GCHART is trying to bin your time data. Just use the DISCRETE option on the VBAR3D statement, and you'll get what you want.
Hope this helps!
Dan
- Mark as New
- Bookmark
- Subscribe
- Mute
- RSS Feed
- Permalink
- Report Inappropriate Content
GCHART is trying to bin your time data. Just use the DISCRETE option on the VBAR3D statement, and you'll get what you want.
Hope this helps!
Dan
- Mark as New
- Bookmark
- Subscribe
- Mute
- RSS Feed
- Permalink
- Report Inappropriate Content
That did it Dan!
Thanks a ton!

Don't miss out on SAS Innovate - Register now for the FREE Livestream!
Can't make it to Vegas? No problem! Watch our general sessions LIVE or on-demand starting April 17th. Hear from SAS execs, best-selling author Adam Grant, Hot Ones host Sean Evans, top tech journalist Kara Swisher, AI expert Cassie Kozyrkov, and the mind-blowing dance crew iLuminate! Plus, get access to over 20 breakout sessions.
Learn how use the CAT functions in SAS to join values from multiple variables into a single value.

Find more tutorials on the SAS Users YouTube channel.
 Click image to register for webinar
Classroom Training Available!
Select SAS Training centers are offering in-person courses. View upcoming courses for:
-
2 replies
-
03-23-2012 03:02 PM
-
727 views
-
0 likes
-
2 in conversation
-
