- Home
- /
- Programming
- /
- Graphics
- /
- Change default colors in SGPLOT
- RSS Feed
- Mark Topic as New
- Mark Topic as Read
- Float this Topic for Current User
- Bookmark
- Subscribe
- Mute
- Printer Friendly Page

- Mark as New
- Bookmark
- Subscribe
- Mute
- RSS Feed
- Permalink
- Report Inappropriate Content
I'm reading "Statistical graphics procedures by example" by Matange and Heath. I'm trying to modify the colors in the sgplot in the example below, but so far I have been not sucessful. Please see below for an example. I'm trying to change the color of "actual" by individual products.
data attrs;
input id $ value $ fillcolor $;
datalines;
actual A Blue
actual B Black
actual B Green
actual D Yellow
;
run;
proc sgplot data = sgbook.product_sales dattrmap=attrs;
hbar product /response = actual barwidth=0.5 attrid=id;
hbar product /response=predict barwidth=0.2;
run;
The above code does not work, how would I change the color for individual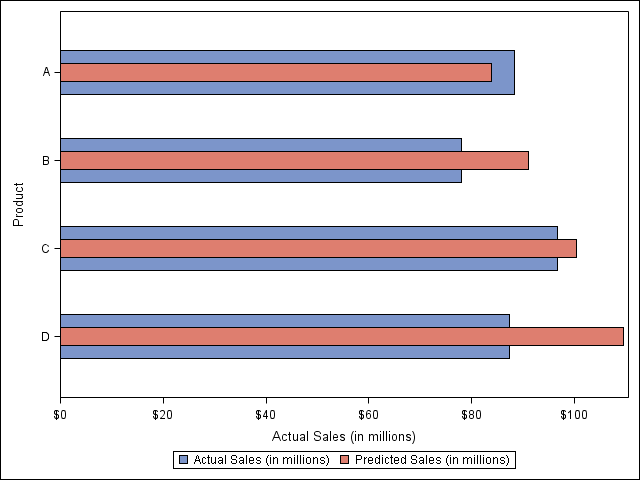 products.

- Mark as New
- Bookmark
- Subscribe
- Mute
- RSS Feed
- Permalink
- Report Inappropriate Content
The problem is that the ATTRID is incorrect. The ATTRID should be the *value* in the ID column -- not the ID column name itself. The ID column is a reserved column name in an ATTMAP, so it does not need to be referenced. In your case, set attrid=actual, and you should get the correct result.
- Mark as New
- Bookmark
- Subscribe
- Mute
- RSS Feed
- Permalink
- Report Inappropriate Content
@DanH, I changed the code following your suggestion, I still do not get the color change, Can you please help
data attrs;
input id $ value $ fillcolor $;
datalines;
ACTUAL A Blue
ACTUAL B Black
ACTUAL C Green
ACTUAL D Yellow
;
run;
proc sgplot data = sgbook.product_sales dattrmap=attrs;
hbar product /response = actual barwidth=0.5 attrid=actual;
hbar product /response=predict barwidth=0.2;
run;
- Mark as New
- Bookmark
- Subscribe
- Mute
- RSS Feed
- Permalink
- Report Inappropriate Content
The other issue is case-sensitivity. Sorry I missed that earlier. The ID value on the ATTRID option must match the case of the ID value in the ATTRMAP data set. Incidentally, We have added a couple of new columns to the ATTRMAP data set for SAS 9.4m3. One of those columns gives you the ability to turn off case-sensitivity.
- Mark as New
- Bookmark
- Subscribe
- Mute
- RSS Feed
- Permalink
- Report Inappropriate Content
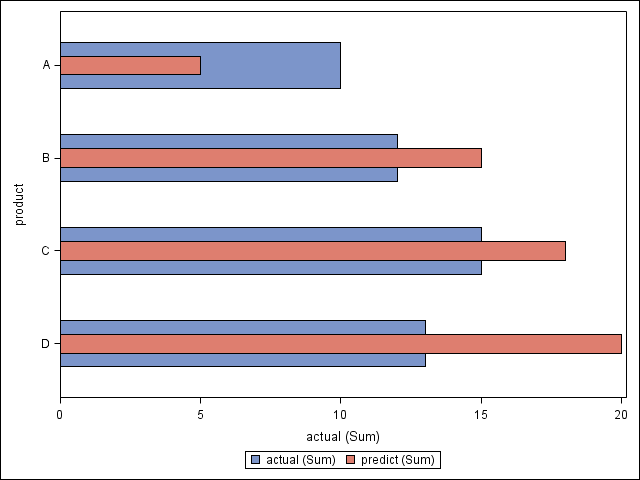
@DanH for some reason, I'm still not getting the right colors. I have changed the codes for easy replicability.
I'm running this code on SAS 9.3 (TS1M2)
data sales;
input product $ actual predict;
datalines;
A 10 5
B 12 15
C 15 18
D 13 20
;
run;
data attrs;
input id $ value $ fillcolor $;
datalines;
actual A blue
actual B black
actual C green
actual D yellow
;
run;
proc sgplot data = sales dattrmap=attrs;
hbar product /response = actual barwidth=0.5 attrid=actual;
hbar product /response=predict barwidth=0.2 ;
run;
- Mark as New
- Bookmark
- Subscribe
- Mute
- RSS Feed
- Permalink
- Report Inappropriate Content
Sorry, I overlooked that you are not using a GROUP variable. Attrmaps only work when there is a GROUP active. For your example, you just need to use FILLATTRS=(color=<some color>) to control the color of the bars.

Don't miss out on SAS Innovate - Register now for the FREE Livestream!
Can't make it to Vegas? No problem! Watch our general sessions LIVE or on-demand starting April 17th. Hear from SAS execs, best-selling author Adam Grant, Hot Ones host Sean Evans, top tech journalist Kara Swisher, AI expert Cassie Kozyrkov, and the mind-blowing dance crew iLuminate! Plus, get access to over 20 breakout sessions.
Learn how use the CAT functions in SAS to join values from multiple variables into a single value.

Find more tutorials on the SAS Users YouTube channel.
 Click image to register for webinar
Classroom Training Available!
Select SAS Training centers are offering in-person courses. View upcoming courses for:
-
5 replies
-
03-06-2015 11:00 AM
-
2682 views
-
3 likes
-
2 in conversation
-
