- Home
- /
- Programming
- /
- Graphics
- /
- Re: Change default color in Graphs from black to dark gray?
- RSS Feed
- Mark Topic as New
- Mark Topic as Read
- Float this Topic for Current User
- Bookmark
- Subscribe
- Mute
- Printer Friendly Page
- Mark as New
- Bookmark
- Subscribe
- Mute
- RSS Feed
- Permalink
- Report Inappropriate Content
I have a lot of codes with graphs. Is there a way to change the default color (text, lines, borders) from black to dark gray? In this way, I would not need to change all of my existing codes.
Hope you guys could help me figure this out.
Accepted Solutions
- Mark as New
- Bookmark
- Subscribe
- Mute
- RSS Feed
- Permalink
- Report Inappropriate Content
Assuming you're using a recent/modern version of SAS (such as 9.2 or higher), as people have said the colors are controlled by the ODS Graph Styles by default.
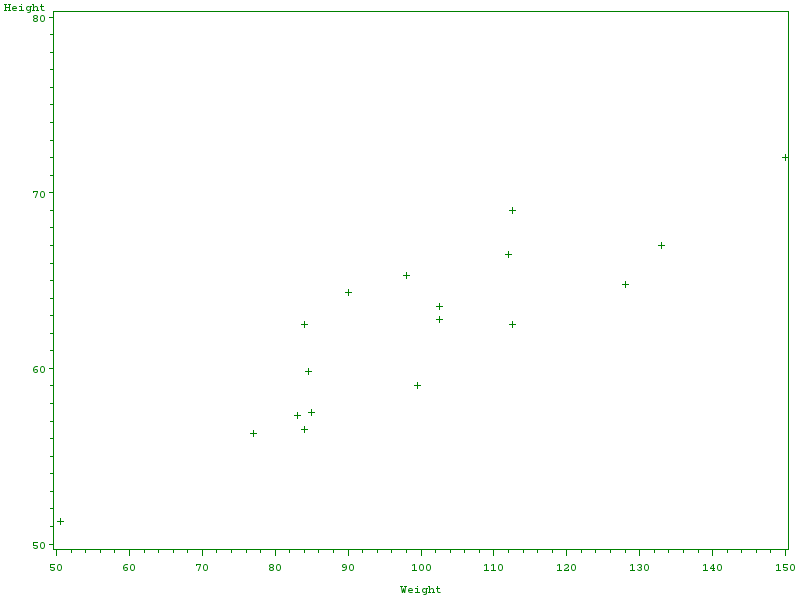
And *if* you happen to be using traditional sas/graph procs (such as gplot, gchart, gmap, gslide) you can turn off the ods graph styles (using the 'nogstyle' option), and then control the default colors using a goptions colors list - the following shows how to turn everything in the gplot green (or you could use a gray such as gray55 or cx555555, or any other color):
goptions reset=all;
options nogstyle;
goptions colors=(green);
proc gplot data=sashelp.class;
plot height*weight;
run;

- Mark as New
- Bookmark
- Subscribe
- Mute
- RSS Feed
- Permalink
- Report Inappropriate Content
Hi,
All output, be it tables, graphs etc. colors, fonts, sizes etc. are controlled by templates. Identify if you have a style statement somewhere then modify that style, or create your own style using proc template. Basic introduction to templates/style:
- Mark as New
- Bookmark
- Subscribe
- Mute
- RSS Feed
- Permalink
- Report Inappropriate Content
Hi. Yes, this is actually my alternative plan. However, I would just like to know if it's possible to change the default instead. Thanks for your suggestion! ![]()
- Mark as New
- Bookmark
- Subscribe
- Mute
- RSS Feed
- Permalink
- Report Inappropriate Content
Well, the defaults themselves are held in templates also. So in styles there is one called "Default". This is used in the absence of any provided. So if you wanted to change the default, then you would need to inherit this (or printer) and change the color etc. to your needs.
- Mark as New
- Bookmark
- Subscribe
- Mute
- RSS Feed
- Permalink
- Report Inappropriate Content
Assuming you're using a recent/modern version of SAS (such as 9.2 or higher), as people have said the colors are controlled by the ODS Graph Styles by default.
And *if* you happen to be using traditional sas/graph procs (such as gplot, gchart, gmap, gslide) you can turn off the ods graph styles (using the 'nogstyle' option), and then control the default colors using a goptions colors list - the following shows how to turn everything in the gplot green (or you could use a gray such as gray55 or cx555555, or any other color):
goptions reset=all;
options nogstyle;
goptions colors=(green);
proc gplot data=sashelp.class;
plot height*weight;
run;

Don't miss out on SAS Innovate - Register now for the FREE Livestream!
Can't make it to Vegas? No problem! Watch our general sessions LIVE or on-demand starting April 17th. Hear from SAS execs, best-selling author Adam Grant, Hot Ones host Sean Evans, top tech journalist Kara Swisher, AI expert Cassie Kozyrkov, and the mind-blowing dance crew iLuminate! Plus, get access to over 20 breakout sessions.
Learn how use the CAT functions in SAS to join values from multiple variables into a single value.
Find more tutorials on the SAS Users YouTube channel.
 Click image to register for webinar
Classroom Training Available!
Select SAS Training centers are offering in-person courses. View upcoming courses for:


