- Home
- /
- Programming
- /
- Graphics
- /
- Can we get second y-axis using "Proc SGpanel" ?
- RSS Feed
- Mark Topic as New
- Mark Topic as Read
- Float this Topic for Current User
- Bookmark
- Subscribe
- Mute
- Printer Friendly Page

- Mark as New
- Bookmark
- Subscribe
- Mute
- RSS Feed
- Permalink
- Report Inappropriate Content
Hi All,
Can we get second y-axis using "Proc SGpanel" ?
By using SGPlot we can achieve by it by "y2axis" statement but how do we get it by using SGPanel procedure.
is it possible ?
Thanks in advance.

- Mark as New
- Bookmark
- Subscribe
- Mute
- RSS Feed
- Permalink
- Report Inappropriate Content
You can get an axis on the right side, but it has to be the same as the Y axis. Y2AXIS option on the plot statement is not supported in SGPANEL.
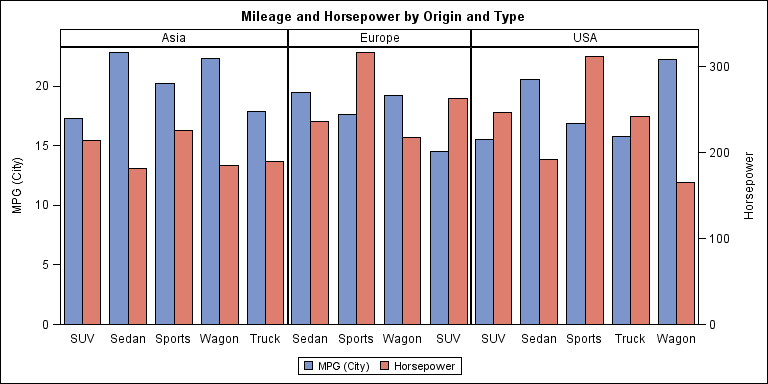
This is where you will need to move up to GTL. Bar Chart and other BASIC plot statements are allowed in Layout DataLattice. But not statements that need data summarization like Histogram, etc. If you need those, you will have to summarize (or min) the data yourself. GTL code attached:
Should work with SAS 9.3. But Columnweight=Proportional needs SAS 9.4.
proc template;
define statgraph Y2Panel;
begingraph;
entrytitle 'Mileage and Horsepower by Origin and Type';
layout datalattice columnvar=origin / headerlabeldisplay=value columnweight=proportional
columnaxisopts=(display=(tickvalues) discreteopts=(tickvaluefitpolicy=none))
rowaxisopts=(offsetmin=0)
row2axisopts=(offsetmin=0);
layout prototype;
barchart x=type y=mpg_city / discreteoffset=-0.2 name='a'
barwidth=0.4 stat=mean fillattrs=graphdata1;
barchart x=type y=horsepower / discreteoffset=0.2 barwidth=0.4
stat=mean yaxis=y2 fillattrs=graphdata2 name='b';
endlayout;
sidebar / spacefill=false;
discretelegend 'a' 'b';
endsidebar;
endlayout;
endgraph;
end;
run;
ods html close;
ods listing;
ods graphics / reset width=8in height=4in imagename='Y2Panel';
proc sgrender data=sashelp.cars(where=(type ne 'Hybrid')) template=Y2Panel;
run;
- Mark as New
- Bookmark
- Subscribe
- Mute
- RSS Feed
- Permalink
- Report Inappropriate Content
Hi Sanjay,
Thank you for your advice, I have idea of GTL and i am using it to produce Yaxis on right side. Just want to know is there any possibility of getting it by SGPANEL.
Thanks once again for you answer and advice.

Don't miss out on SAS Innovate - Register now for the FREE Livestream!
Can't make it to Vegas? No problem! Watch our general sessions LIVE or on-demand starting April 17th. Hear from SAS execs, best-selling author Adam Grant, Hot Ones host Sean Evans, top tech journalist Kara Swisher, AI expert Cassie Kozyrkov, and the mind-blowing dance crew iLuminate! Plus, get access to over 20 breakout sessions.
Learn how use the CAT functions in SAS to join values from multiple variables into a single value.

Find more tutorials on the SAS Users YouTube channel.
 Click image to register for webinar
Classroom Training Available!
Select SAS Training centers are offering in-person courses. View upcoming courses for:
-
2 replies
-
05-17-2015 05:46 AM
-
6950 views
-
5 likes
-
2 in conversation
-
