- Home
- /
- Programming
- /
- Graphics
- /
- Re: Can I generate a jittered scatterplot with tight jittering and an ...
- RSS Feed
- Mark Topic as New
- Mark Topic as Read
- Float this Topic for Current User
- Bookmark
- Subscribe
- Mute
- Printer Friendly Page

- Mark as New
- Bookmark
- Subscribe
- Mute
- RSS Feed
- Permalink
- Report Inappropriate Content
I’m using SAS 9.4.
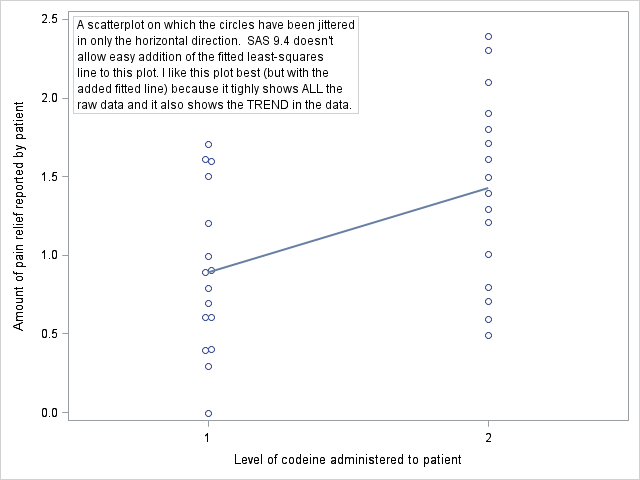
Please run the attached code. I would like to add the regression line to the third of the three scatterplots. But, so far, I haven’t been able to find an easy way to do that.
Of course, I can use the SG Annotation facility to add the line, but that’s inconvenient because it requires explicit computation and specification of the attributes of the line.
It’s statistically sensible to add the line to the scatterplot because the scatterplot reflects a real situation in experimental research. This is the situation where the predictor variable is discrete (by virtue of the fact that this variable was MANIPULATED to have discrete values by the experimenter) but the underlying DIMENSION of the predictor variable is continuous. Therefore, adding the regression line to the scatterplot is reasonable as a way of (roughly) illustrating through interpolation what the values of the response variable do between the two used values of the predictor variable on the horizontal axis of the scatterplot. Also, the regression line helps the viewer to recognize the continuous nature of the relationship between the response and predictor variables.
Is there an easy way to add the line?
I understand that scatterplots with “dodging” points are difficult to program, and they may run into situations where the points from different values on the horizontal axis collide with each other. But that doesn’t mean that the scatterplots shouldn’t be available for the many cases in which the points don’t collide and thus the scatterplots are useful.
Presumably the programmer could build a map in memory of the array of points that are lying on the surface of the scatterplot. And if the array is too tight and therefore the points start to collide with each other, then the procedure could try to make the points smaller. And if that doesn’t work, the procedure could stop with an error message that clearly explains the problem.
Note that I’ve got SAS to generate the tightly dodged points on the third scatterplot by specifying that the horizontal axis is discrete. However, that gives rise to another serious problem if the variable plotted on the horizontal axis has values that aren’t equally spaced. In that case, if I specify that the horizontal axis is discrete, then the values on the horizontal axis will equally spaced on the axis even though in reality they should be spaced according to the values.
For me, the ideal solution to this problem would be to have an option on the SCATTER statement that permits “dodging” of points in the horizontal direction, where “dodging” means that the points are only offset enough to avoid collisions, and not randomly offset as they are with the “jitter” option. I suppose that dodging in the vertical direction or dodging in both directions might also sometimes be useful.
Thanks for your help,
Don Macnaughton
Accepted Solutions

- Mark as New
- Bookmark
- Subscribe
- Mute
- RSS Feed
- Permalink
- Report Inappropriate Content
Dan and I have looked into this and the solution depends on the maintenance level of the SAS9.4 release. So, it helps if you include the "full" release number. 🙂
- If you have SAS 9.4M2, you can use JITTERWIDTH option on the SCATTER statement. JitterWidth=0.1 works.
- If you have SAS 9.4M1 or higher, you can use this "trick". Create a dummy column Grp='a'. Then assign this to the scatter option GROUP and set GroupDisplay=Cluster as follows. This also does the non-random jitter. See graph below:
scatter x=Codeine y=Relief / group=Grp groupdisplay=cluster jitter;
3. If you have SAS 9.4M0, then you will need to use GTL with similar code. Jitterwidth option is supported on the SCATTERPLOT statement in GTL at SAS 9.4M0. You can get GTL code out of SGPLOT by using the TMPLOUT option on the proc statement.
- Mark as New
- Bookmark
- Subscribe
- Mute
- RSS Feed
- Permalink
- Report Inappropriate Content
Sanjay,
Thank you. I have SAS 9.4M2. Curiously, your first solution still causes the two points for Codeine level 1 at Relief level 0.4 to be overlaid. However, your second solution works perfectly.
I hope that SAS will provide an easier way to get the desired behavior, perhaps with a "dodge" option for the SCATTER statement.
I tried to find the way to specify that my question is answered, but I couldn't find the way.
Don Macnaughton
- Mark as New
- Bookmark
- Subscribe
- Mute
- RSS Feed
- Permalink
- Report Inappropriate Content
I am glad one of the options worked. We have plans to add a "Bee Swarm" option for Jitter that will be a better way for rmany cases.

Don't miss out on SAS Innovate - Register now for the FREE Livestream!
Can't make it to Vegas? No problem! Watch our general sessions LIVE or on-demand starting April 17th. Hear from SAS execs, best-selling author Adam Grant, Hot Ones host Sean Evans, top tech journalist Kara Swisher, AI expert Cassie Kozyrkov, and the mind-blowing dance crew iLuminate! Plus, get access to over 20 breakout sessions.
Learn how use the CAT functions in SAS to join values from multiple variables into a single value.

Find more tutorials on the SAS Users YouTube channel.
 Click image to register for webinar
Classroom Training Available!
Select SAS Training centers are offering in-person courses. View upcoming courses for:
-
3 replies
-
02-06-2015 10:17 AM
-
3226 views
-
1 like
-
2 in conversation
-
