- Home
- /
- Programming
- /
- Graphics
- /
- Bubble Size
- RSS Feed
- Mark Topic as New
- Mark Topic as Read
- Float this Topic for Current User
- Bookmark
- Subscribe
- Mute
- Printer Friendly Page

- Mark as New
- Bookmark
- Subscribe
- Mute
- RSS Feed
- Permalink
- Report Inappropriate Content
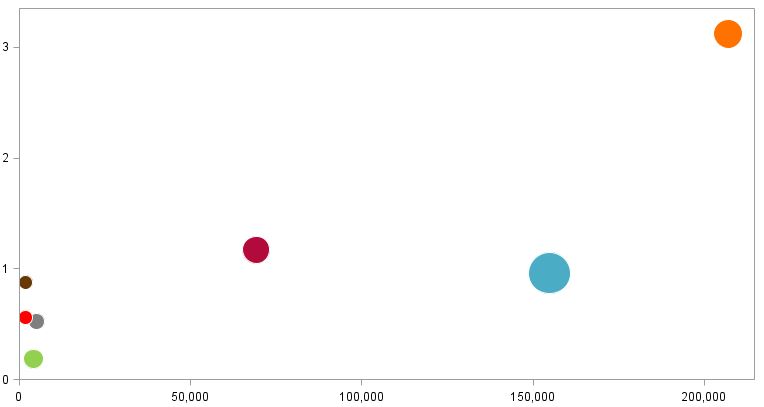
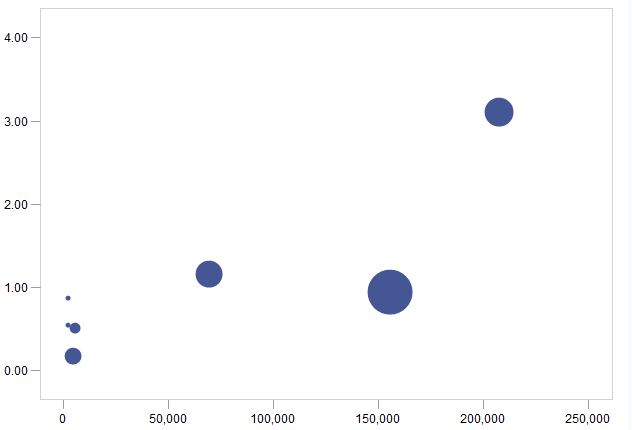
Can anyone tell me why the bubbles appear different sizes when you plot it sgplot and gplot? You can tell the most on the smaller bubbles. I haven't made any changes to the bubble size in either and the code really only has the variables and nothing else fancy. The one with colored bubbles is sgplot and the one with blue bubbles is gplot. Thanks!
Accepted Solutions

- Mark as New
- Bookmark
- Subscribe
- Mute
- RSS Feed
- Permalink
- Report Inappropriate Content
These are two completely different technologies and graphing systems. You will find differences in many other plots, such as Scatter, VBar, and so on.
Besides that, the SGPLOT Bubble statement uses BRADIUSMIN and BRADIUSMAX for lowest and largest bubble size for mapping the data min and max. Default values are 7 and 21 pixels. The scaling is NOT proportional. That is, the slope of the scale line does not pass through zero. This can be done using the GTL BubblePlot with the RELATIVESCALETYPE option. This will force the scaling to be linear between zero and bubble max. Bubble min will be a cutoff.

Don't miss out on SAS Innovate - Register now for the FREE Livestream!
Can't make it to Vegas? No problem! Watch our general sessions LIVE or on-demand starting April 17th. Hear from SAS execs, best-selling author Adam Grant, Hot Ones host Sean Evans, top tech journalist Kara Swisher, AI expert Cassie Kozyrkov, and the mind-blowing dance crew iLuminate! Plus, get access to over 20 breakout sessions.
Learn how use the CAT functions in SAS to join values from multiple variables into a single value.

Find more tutorials on the SAS Users YouTube channel.
 Click image to register for webinar
Classroom Training Available!
Select SAS Training centers are offering in-person courses. View upcoming courses for:
-
1 reply
-
06-28-2013 10:43 AM
-
1022 views
-
0 likes
-
2 in conversation
-
