- Home
- /
- Programming
- /
- Graphics
- /
- Axis labels being cut short on chart
- RSS Feed
- Mark Topic as New
- Mark Topic as Read
- Float this Topic for Current User
- Bookmark
- Subscribe
- Mute
- Printer Friendly Page

- Mark as New
- Bookmark
- Subscribe
- Mute
- RSS Feed
- Permalink
- Report Inappropriate Content
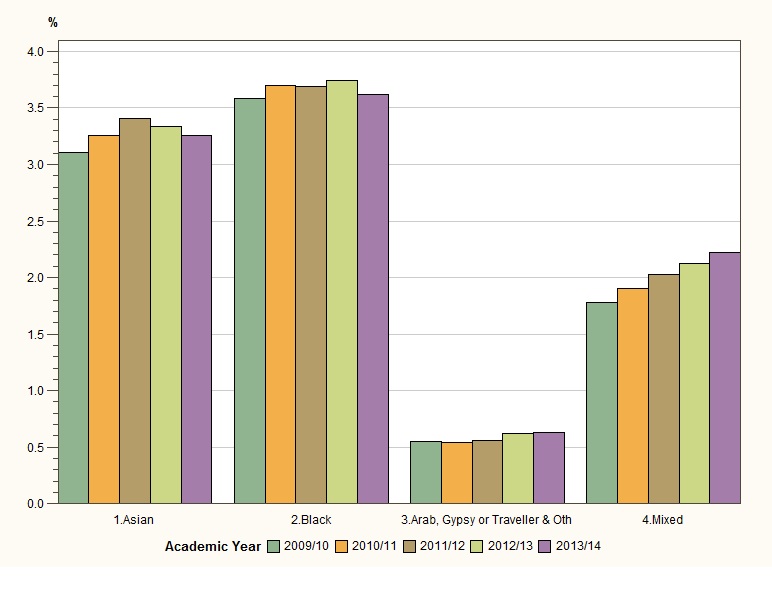
I am successfully producing a bar chart however one of the variables within the "group" variable of my code is quite long and therefore not being fully displayed on the chart.
I am running the below code to produce the output chart (displayed below the code) however on the 3rd set of bar charts you can see that it says "3. Arab, Gypsy or Traveller & Oth" when I need to to say the full value in the field "3.Arab, Gypsy or Traveller & Other"
axis1 label=none value=none;
axis2 label=("%") ;
axis3 label=none;
legend1 label=("Academic Year");
proc gchart data = chart_data (where = ( ethnic_band NE '' and
ethnic = '' and
ethnic_band in ('1.Asian',
'2.Black',
'3.Arab, Gypsy or Traveller & Other',
'4.Mixed') ));
vbar acad_yr / discrete
type = sum
sumvar = ugpg_headcount_PctSum_100
group = ethnic_band
subgroup = acad_yr
space=0
gspace=2.5
maxis=axis1
raxis=axis2
gaxis=axis3
legend=legend1
autoref
clipref
cref=graycc
coutline=black
des = ' '
description = ' ' ;
run;
quit;
options nomprint;
ods rtf close;
ods listing;

- Mark as New
- Bookmark
- Subscribe
- Mute
- RSS Feed
- Permalink
- Report Inappropriate Content
For GCHART, the SPLIT option on the AXIS statement might work for you. I'm not sure of your SAS version, but SGPLOT can handle this situation as well if you have the right version. Hope this helps!

Don't miss out on SAS Innovate - Register now for the FREE Livestream!
Can't make it to Vegas? No problem! Watch our general sessions LIVE or on-demand starting April 17th. Hear from SAS execs, best-selling author Adam Grant, Hot Ones host Sean Evans, top tech journalist Kara Swisher, AI expert Cassie Kozyrkov, and the mind-blowing dance crew iLuminate! Plus, get access to over 20 breakout sessions.
Learn how use the CAT functions in SAS to join values from multiple variables into a single value.

Find more tutorials on the SAS Users YouTube channel.
 Click image to register for webinar
Classroom Training Available!
Select SAS Training centers are offering in-person courses. View upcoming courses for:
-
1 reply
-
04-17-2015 07:38 AM
-
858 views
-
1 like
-
2 in conversation
-
