- Home
- /
- Programming
- /
- Graphics
- /
- Re: Ascending Order of my Graph
- RSS Feed
- Mark Topic as New
- Mark Topic as Read
- Float this Topic for Current User
- Bookmark
- Subscribe
- Mute
- Printer Friendly Page

- Mark as New
- Bookmark
- Subscribe
- Mute
- RSS Feed
- Permalink
- Report Inappropriate Content
Hi,
I plotted a chart which is attached. But I'd like to know is there any way that I can plot in an ascending order of the BLUE portion of the graph. I want my chart to be in ascending order (blue color).
Help me.
Naresh


- Mark as New
- Bookmark
- Subscribe
- Mute
- RSS Feed
- Permalink
- Report Inappropriate Content
Is the graph part of the code available for posting? And, what version of SAS are you using?
- Mark as New
- Bookmark
- Subscribe
- Mute
- RSS Feed
- Permalink
- Report Inappropriate Content
proc gchart data=Multiplot;
vbar Client / sumvar = percent discrete inside = subpct
subgroup = cross;
run;
quit;
9.3 Version

- Mark as New
- Bookmark
- Subscribe
- Mute
- RSS Feed
- Permalink
- Report Inappropriate Content
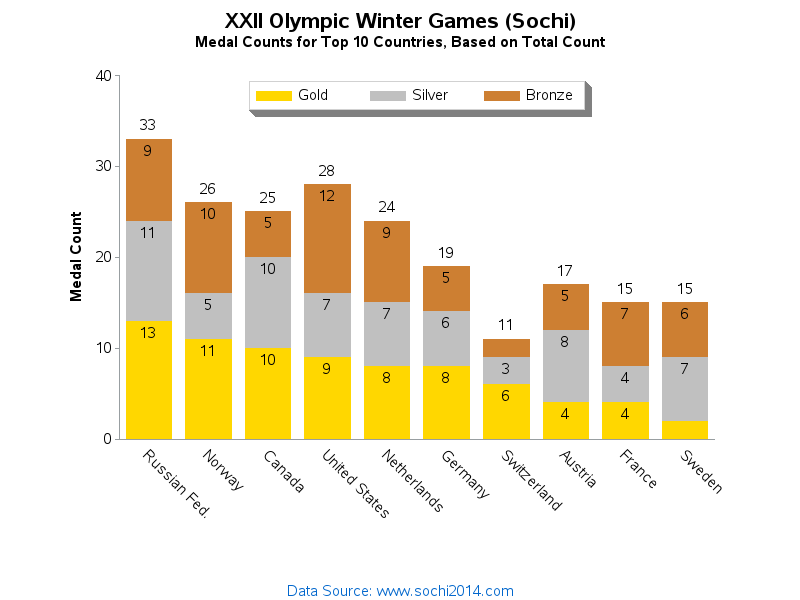
Here is an example where I sort the bars by 1 of the colored bar segments (in this case, the number of gold Olympic medals)...
http://robslink.com/SAS/democd70/sochi_olympics_2014.htm
http://robslink.com/SAS/democd70/sochi_olympics_2014_info.htm
I sort the data in the desired order, and then assign a 'bar_order' variable, and plot the bars by those numeric bar_order values. I then create a user-defined-format so the numeric bar-order values show up on the axis as the desired text (rather than their numeric value).

Don't miss out on SAS Innovate - Register now for the FREE Livestream!
Can't make it to Vegas? No problem! Watch our general sessions LIVE or on-demand starting April 17th. Hear from SAS execs, best-selling author Adam Grant, Hot Ones host Sean Evans, top tech journalist Kara Swisher, AI expert Cassie Kozyrkov, and the mind-blowing dance crew iLuminate! Plus, get access to over 20 breakout sessions.
Learn how use the CAT functions in SAS to join values from multiple variables into a single value.

Find more tutorials on the SAS Users YouTube channel.
 Click image to register for webinar
Classroom Training Available!
Select SAS Training centers are offering in-person courses. View upcoming courses for:
-
3 replies
-
09-23-2014 04:14 PM
-
992 views
-
0 likes
-
3 in conversation
-
