- Home
- /
- Programming
- /
- Graphics
- /
- Adding superscript on yaxis values in proc gplot
- RSS Feed
- Mark Topic as New
- Mark Topic as Read
- Float this Topic for Current User
- Bookmark
- Subscribe
- Mute
- Printer Friendly Page

- Mark as New
- Bookmark
- Subscribe
- Mute
- RSS Feed
- Permalink
- Report Inappropriate Content
Hi,
I want to display yaxis values like 10 {superscript}0, 10 {superscript}1, 10 {superscript}2 etc .. is there a way I can put 0, 1, 2 etc as a superscript on yaxis values?
Thanks,

- Mark as New
- Bookmark
- Subscribe
- Mute
- RSS Feed
- Permalink
- Report Inappropriate Content
These axis tick values make sense for a log axis. Then, equally spaced tick values can have 10**2, 10**3, etc. For log axis use TYPE=log on the axis statement for SGPLOT.
It is a little harder to understand this for a linear axis, you likely have numbers like 100, 200, 300 to 800. In this case, just a 10**2, 10**3 may not suffice. Please provide more details, or attach a picture. With SAS 9.3, you can use the SGANNO facility to make such customizations.
- Mark as New
- Bookmark
- Subscribe
- Mute
- RSS Feed
- Permalink
- Report Inappropriate Content
Thanks Sanjay,
My Yaxis is log. Attached is the picture of the graph. What I want is 10 (to the power) -2 and so on ..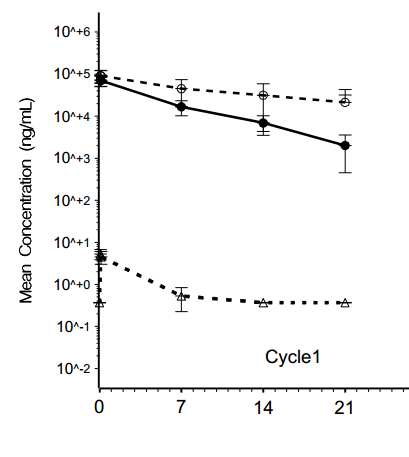
- Mark as New
- Bookmark
- Subscribe
- Mute
- RSS Feed
- Permalink
- Report Inappropriate Content
Also, forgot to mention that I am using SAS 9.2
Thanks
- Mark as New
- Bookmark
- Subscribe
- Mute
- RSS Feed
- Permalink
- Report Inappropriate Content
This looks like a simple log axis available with With SAS 9.2 SGPLOT. Set axis TYPE=LOG, base 10 is default. Use LOGSTYLE option:
LOGSTYLE= LOGEXPAND | LOGEXPONENT | LINEAR. Logexpand will show you 0.1, 1, 10, 100, 1000 on the Y axis. Log exponenet will display only the exponent - -2, -1, 0, 1, 2, 3. With SAS 9.2, I cannot think of a way to get 10^3 like you want.

- Mark as New
- Bookmark
- Subscribe
- Mute
- RSS Feed
- Permalink
- Report Inappropriate Content
SFO,
I think you'll have to hard-code each axis tickmark to use the superscript characters in gplot.
Since recent versions of SAS/Graph support unicode, you can do this using the built-in superscripted characters of a font such as "arial unicode ms". The characters and their numeric codes are described here:
Unicode subscripts and superscripts - Wikipedia, the free encyclopedia
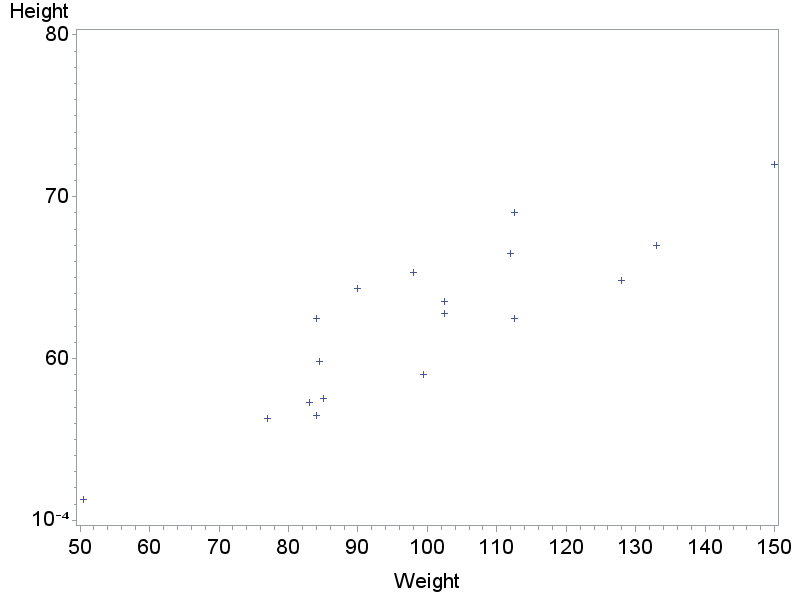
For example, the hex code '2074'x represents a superscripted '4' and can be hard-coded as an axis tickmark as follows (this example shows how to hard-code it in the first tick mark of the y-axis):
goptions htext=3.5pct;
axis1 value=(t=1 '10' font="arial unicode ms/unicode" '2074'x);
proc gplot data=sashelp.class;
plot height*weight / vaxis=axis1;
run;

- Mark as New
- Bookmark
- Subscribe
- Mute
- RSS Feed
- Permalink
- Report Inappropriate Content
Since some of the numbers you want to superscript will need a minus sign, I'll elaborate a little on that ...
The character for a superscripted 'minus' is '207b'x, and you can combine that with the superscripted number as follows:
goptions htext=3.5pct;
axis1 value=(t=1 '10' font="arial unicode ms/unicode" '207b2074'x);
proc gplot data=sashelp.class;
plot height*weight / vaxis=axis1;
run;

Don't miss out on SAS Innovate - Register now for the FREE Livestream!
Can't make it to Vegas? No problem! Watch our general sessions LIVE or on-demand starting April 17th. Hear from SAS execs, best-selling author Adam Grant, Hot Ones host Sean Evans, top tech journalist Kara Swisher, AI expert Cassie Kozyrkov, and the mind-blowing dance crew iLuminate! Plus, get access to over 20 breakout sessions.
Learn how use the CAT functions in SAS to join values from multiple variables into a single value.

Find more tutorials on the SAS Users YouTube channel.
 Click image to register for webinar
Classroom Training Available!
Select SAS Training centers are offering in-person courses. View upcoming courses for:
-
6 replies
-
07-17-2013 06:11 PM
-
2789 views
-
0 likes
-
3 in conversation
-
