- Home
- /
- Analytics
- /
- Forecasting
- /
- Re: Polynomial equation for sales forecast
- RSS Feed
- Mark Topic as New
- Mark Topic as Read
- Float this Topic for Current User
- Bookmark
- Subscribe
- Mute
- Printer Friendly Page

- Mark as New
- Bookmark
- Subscribe
- Mute
- RSS Feed
- Permalink
- Report Inappropriate Content
Hi Experts,
I've 12 months data (Number of orders) and trying to explore a model which can be used for forecasting. I found 2nd degree polynomial model which seems to represent pattern in a better way. Value of R²=0.70. Please see below the equation.
| y = 308.77x2 - 2662.8x + 31837 |
Can we use polynomial equation for sales forecast? My concern is when we go further into fututre orders per month will soon be doubled which business people will not accept. Any suggestions on this one please. I've attached chart for your review please.
Regards,
Accepted Solutions

- Mark as New
- Bookmark
- Subscribe
- Mute
- RSS Feed
- Permalink
- Report Inappropriate Content
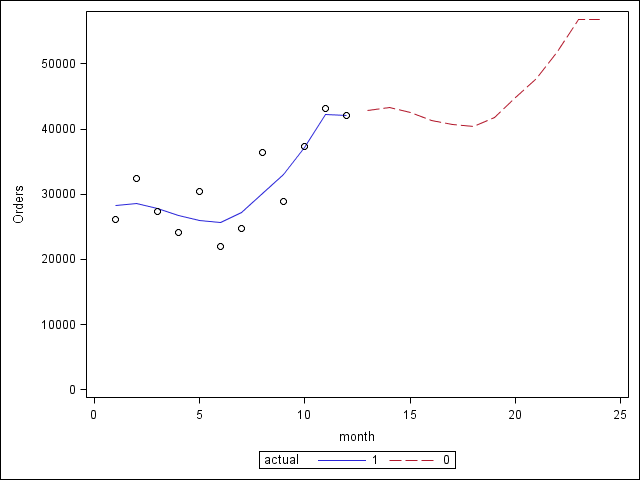
I agree with Paige Miller. Fitting a quadratic curve to a time series is perilous. With twelve points, you will necessarily have to make many assumptions to build any kind of predictive model. For example
1) There is a trend that will go on next year
2) There is a seasonal pattern that will repeat next year
Those could lead to the following additive model:
data test;
infile datalines missover;
input month Orders;
yearMonth = mod(month,12);
actual= not missing(orders);
datalines;
1 26156
2 32396
3 27415
4 24129
5 30350
6 21992
7 24705
8 36434
9 28858
10 37353
11 43137
12 42119
13
14
15
16
17
18
19
20
21
22
23
24
;
title;
proc gam data=test;
model orders = param(month) spline(yearmonth);
output out=gamout predicted;
run;
proc sgplot data=gamout;
series x=month y=p_orders/ group=actual;
scatter x=month y=orders;
yaxis min=0;
run;

- Mark as New
- Bookmark
- Subscribe
- Mute
- RSS Feed
- Permalink
- Report Inappropriate Content
Hard to say, without more VERY BASIC information
What is x?
What is y?
Paige Miller
- Mark as New
- Bookmark
- Subscribe
- Mute
- RSS Feed
- Permalink
- Report Inappropriate Content
Hi Paige,
x is month (From 1 to 12)
y is number of orders
Please see below table that contains month, orders and predicted orders. At month 20 predicted orders become almost 100,000.
Regards,
| y = 308.77x2 - 2662.8x + 31837 | ||
| month | Orders | Predicted Orders |
| 1 | 26156 | 29482.97 |
| 2 | 32396 | 27746.48 |
| 3 | 27415 | 26627.53 |
| 4 | 24129 | 26126.12 |
| 5 | 30350 | 26242.25 |
| 6 | 21992 | 26975.92 |
| 7 | 24705 | 28327.13 |
| 8 | 36434 | 30295.88 |
| 9 | 28858 | 32882.17 |
| 10 | 37353 | 36086 |
| 11 | 43137 | 39907.37 |
| 12 | 42119 | 44346.28 |
| 13 | 49402.73 | |
| 14 | 55076.72 | |
| 15 | 61368.25 | |
| 16 | 68277.32 | |
| 17 | 75803.93 | |
| 18 | 83948.08 | |
| 19 | 92709.77 | |
| 20 | 102089 | |
- Mark as New
- Bookmark
- Subscribe
- Mute
- RSS Feed
- Permalink
- Report Inappropriate Content
The idea that month number has a quadratic relationship with orders ... well, let me just say that this is bizarre ... I wouldn't use such a model, even if the R-squared was 0.7. You have discovered a coincidence, not a predictive model.
Normally, forecasts of economic activity ... in this case orders ... are based upon time series models, perhaps with some seasonality built in, with X being some measures of customer's economic well being, or the economic well being of the economy as whole (or both)
Paige Miller

- Mark as New
- Bookmark
- Subscribe
- Mute
- RSS Feed
- Permalink
- Report Inappropriate Content
Hello -
This might be a little bit off topic, but R square should not be used for time series forecasts. For one thing, it overlooks bias in forecasts. A model can have a perfect R square, yet the values of the forecasts could be substantially different from the values for all forecasts. Also, a model could have an R square of zero but provide perfect forecasts if the mean were forecasted correctly and no variation occurred in the data.
See: http://repository.upenn.edu/cgi/viewcontent.cgi?article=1182&context=marketing_papers for more details.
Thanks,
Udo
- Mark as New
- Bookmark
- Subscribe
- Mute
- RSS Feed
- Permalink
- Report Inappropriate Content
I agree with Paige Miller. Fitting a quadratic curve to a time series is perilous. With twelve points, you will necessarily have to make many assumptions to build any kind of predictive model. For example
1) There is a trend that will go on next year
2) There is a seasonal pattern that will repeat next year
Those could lead to the following additive model:
data test;
infile datalines missover;
input month Orders;
yearMonth = mod(month,12);
actual= not missing(orders);
datalines;
1 26156
2 32396
3 27415
4 24129
5 30350
6 21992
7 24705
8 36434
9 28858
10 37353
11 43137
12 42119
13
14
15
16
17
18
19
20
21
22
23
24
;
title;
proc gam data=test;
model orders = param(month) spline(yearmonth);
output out=gamout predicted;
run;
proc sgplot data=gamout;
series x=month y=p_orders/ group=actual;
scatter x=month y=orders;
yaxis min=0;
run;
- Mark as New
- Bookmark
- Subscribe
- Mute
- RSS Feed
- Permalink
- Report Inappropriate Content
Thanks PG for suggesting a solution.
.jpg")
Catch up on SAS Innovate 2026
Nearly 200 sessions are now available on demand with the SAS Innovate Digital Pass.
Explore Now →- Spring 2026 ESUG Meeting - Social Celebration | 02-Jun-2026
- Spring 2026 ESUG Meeting | 03-Jun-2026
-
6 replies
-
04-09-2014 11:36 AM
-
6904 views
-
9 likes
-
4 in conversation
-
