- Home
- /
- Analytics
- /
- Forecasting
- /
- How to improve the precision of forecasting of roll rate
- RSS Feed
- Mark Topic as New
- Mark Topic as Read
- Float this Topic for Current User
- Bookmark
- Subscribe
- Mute
- Printer Friendly Page

- Mark as New
- Bookmark
- Subscribe
- Mute
- RSS Feed
- Permalink
- Report Inappropriate Content
Hi Collegues,
I have the attached data set.
Table 1 Column D calculates the roll rate of outstanding balance from delinquency cycle_1 to cycle_1.
Table 1 Cell c28 shows the moving sum equation I have used to forecast the value of that cell based on previous 24 months actual data.
Column N of Table 2 applies the same forecasting equation for a known data range and column P calculates how well our prediction equation does the forecasting.
Sad to say that the % absolute deviation is way too unacceptable.
Could any one help me to improve this equation to increase the forecasting precision.
Thanks
Mirisage
Accepted Solutions

- Mark as New
- Bookmark
- Subscribe
- Mute
- RSS Feed
- Permalink
- Report Inappropriate Content
Hi Mirisage -
Without context it is very difficult to recommend any forecasting approach - nevertheless here are some thoughts about your forecasts which might be useful:
I imported your data (actual values of Cycle_2 and your forecasts) to SAS and created a forecast plot (using the last fully observed data point - e.g. Jan2012 - as out-of-sample data):
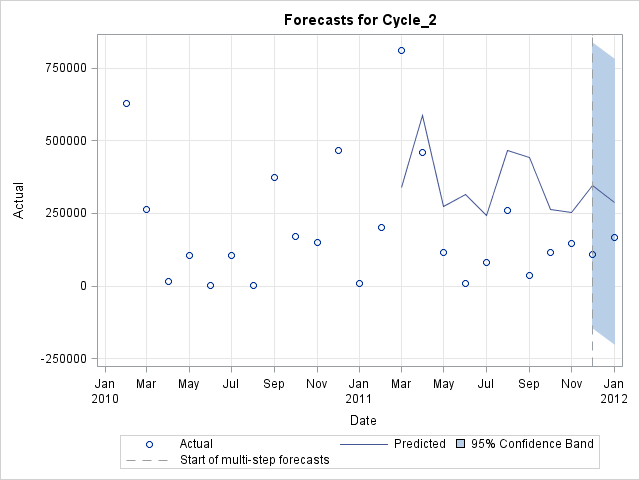
I think you are facing 2 issues with your forecasts - too high and not unbiased (which means you are constantly overforecasting).
Now depending on your goal this can be a good or bad thing - like I said it is difficult to provide more advise in this kind of forum.
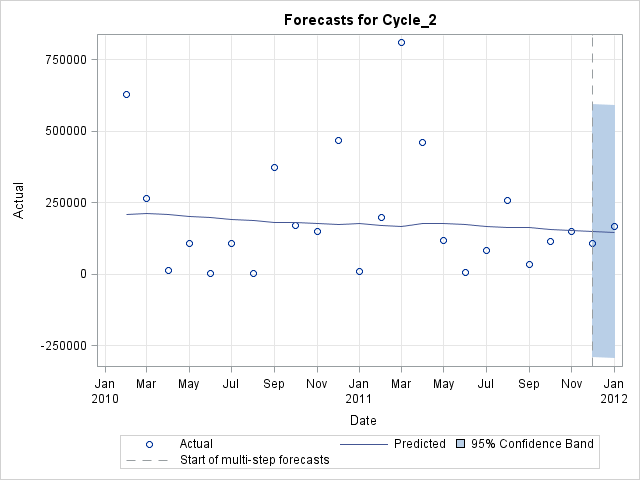
In fact, I also run PROC ESM on your data - and it turns out that a damp-trend ESM model does a fairly good job predicting Jan 2012, given the type of data at hand.
My suggestion would be to get your hands on decent stastistical forecasting software, which will support you figuring out a forecasting model for you.
SAS would be my obvious choice - but I'm biased.
Thanks,
Udo
- Mark as New
- Bookmark
- Subscribe
- Mute
- RSS Feed
- Permalink
- Report Inappropriate Content
Hello -
Which SAS procedure did you use to create your forecasts or are you looking for feedback on your MS Excel approach?
Thanks,
Udo
- Mark as New
- Bookmark
- Subscribe
- Mute
- RSS Feed
- Permalink
- Report Inappropriate Content
Hi Udo,
Thanks.
I had 1 million records data set in CSV. With the support of the SAS discussion forum, I have done a number of data manipulations using SAS to get the aggregate dollar values to the stage that is shown in the attached Excel sheet (attahced in my original query).
The forcasting part I am going to using the MS Excel.
I am looking for feedback on my MS Excel approach. How to get forecasted figures with a narrow deviation.
Thank you
Mirisage
- Mark as New
- Bookmark
- Subscribe
- Mute
- RSS Feed
- Permalink
- Report Inappropriate Content
Hi Mirisage -
Without context it is very difficult to recommend any forecasting approach - nevertheless here are some thoughts about your forecasts which might be useful:
I imported your data (actual values of Cycle_2 and your forecasts) to SAS and created a forecast plot (using the last fully observed data point - e.g. Jan2012 - as out-of-sample data):
I think you are facing 2 issues with your forecasts - too high and not unbiased (which means you are constantly overforecasting).
Now depending on your goal this can be a good or bad thing - like I said it is difficult to provide more advise in this kind of forum.
In fact, I also run PROC ESM on your data - and it turns out that a damp-trend ESM model does a fairly good job predicting Jan 2012, given the type of data at hand.
My suggestion would be to get your hands on decent stastistical forecasting software, which will support you figuring out a forecasting model for you.
SAS would be my obvious choice - but I'm biased.
Thanks,
Udo
- Mark as New
- Bookmark
- Subscribe
- Mute
- RSS Feed
- Permalink
- Report Inappropriate Content
Hi Udo,
Thank you very much for your conccern and help.
I am working on SAS 9.2 version in EG. Does this SAS version help me to run foreacsting plot, proc ESM etc. that you have run.
I googled using "proc ESM" as key word. As I understand we need SAS/ETS which is another SAS module that we have to buy seprately, isn't it?
Please let me know thanks.
Mirisage
- Mark as New
- Bookmark
- Subscribe
- Mute
- RSS Feed
- Permalink
- Report Inappropriate Content
Hi Mirisage -
Yes, PROC ESM is part of SAS/ETS software. For details about this procedure please check out:
http://support.sas.com/documentation/cdl/en/etsug/63348/HTML/default/viewer.htm#esm_toc.htm
You can test if you have access to SAS/ETS already by trying to use one of the Time Series Tasks of EG:
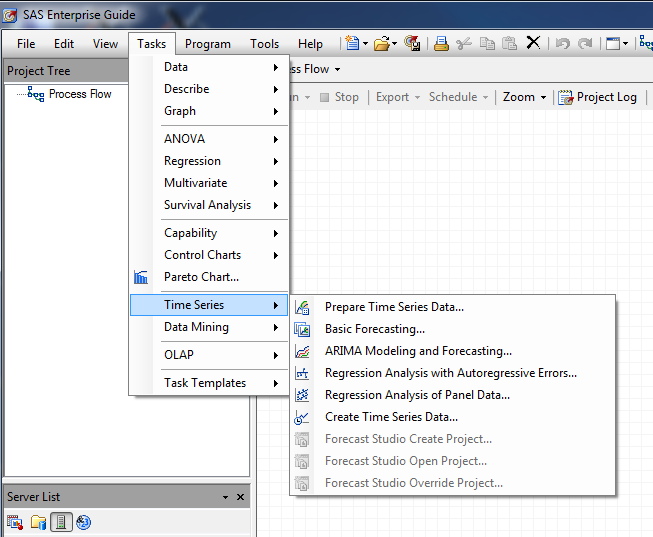
As of today PROC ESM is not part of these EG tasks, but you can run it using SAS Code in EG (provided you have access of course).
For details about the SAS forecasting portfolio you might want to check out:
http://www.sas.com/technologies/analytics/forecasting/index.html
Hope this is useful.
Thanks,
Udo
- Mark as New
- Bookmark
- Subscribe
- Mute
- RSS Feed
- Permalink
- Report Inappropriate Content
Hi Udo,
This is very much useful. I'll check this.
Thank you very much.
Mirisage
.jpg")
Catch up on SAS Innovate 2026
Nearly 200 sessions are now available on demand in the Innovate Hub.
Watch Now →- Ask the Expert: R and SAS Working Seamlessly Together: Unlocking PROC R in Viya for Life Sciences | 11-Jun-2026
- Ask the Expert: Can Agents Reduce Planning Friction in CPG Supply Chains? | 16-Jun-2026
- Ask the Expert: Get Meaningful Results With New Features in SAS Customer Intelligence 360 | 25-Jun-2026
-
6 replies
-
07-13-2012 10:54 PM
-
7125 views
-
3 likes
-
2 in conversation
-
