- Home
- /
- Programming
- /
- Enterprise Guide
- /
- Re: Summary Table questions in EG
- RSS Feed
- Mark Topic as New
- Mark Topic as Read
- Float this Topic for Current User
- Bookmark
- Subscribe
- Mute
- Printer Friendly Page

- Mark as New
- Bookmark
- Subscribe
- Mute
- RSS Feed
- Permalink
- Report Inappropriate Content
Hi everyone, I am a beginner newbie with EG and recently just created my first Summary Table. I have 3 questions I hope someone could help me with. I do know a little SQL code, but was hoping to do everything in EG. This is my 2nd day trying to figure this out.....![]()
Here is the Summary Table I created:
And here are my questions:
- In my columns, my data includes the numbers 1, 2 & 3, which everyone does not know what each mean. Because this is a summary table, how can I get the numbers for reflect text instead? (1=Not Met, 2=Met, etc...)
- In my columns, the second most column of course is a percentage. How can I format these cells to percentage? (When I go to the summary table data options and change it to a percentage format, it changes the decimal places (8.7=870%). I am thinking if I can't do it from within EG that I need to multiple by 100 somewhere as a last resort but can't figure out if I can do that in the code. ??
- My last column would be a calculated column of the Met and High Met columns. Because this table is created on the fly, I do not know how to "add" an additional calculated column in a Summary Table. ?
Thanks in advance, and ANY help would be so appreciated!
CJ

- Mark as New
- Bookmark
- Subscribe
- Mute
- RSS Feed
- Permalink
- Report Inappropriate Content
1. Use a format. This is a very convenient feature of SAS, and of EG, and it's really worth learning. You can read about it in the SAS help. There is an EG task to create one, or you can use SAS code like the following (assuming that your variable is numeric; slightly different syntax if it's character).
PROC FORMAT LIB=WORK;
VALUE METFMT
1 = "Not Met"
2 = "Met"
3 = "High Met";
RUN;
and then apply it to your variable at creation time or in your summary tables task.
2. Are you using the summary tables task to create the percentages? If so, I don't understand why the percentage formats don't work. Maybe somebody else can shed some light on this.
3. This is going to be tricky. It would be easy if you wanted the total of all three, but just getting 2 and 3 is a challenge. I suggest you use the query builder to create a dataset based on your dataset, but with an additional column (let's call it ALLHIGH) that you create with an advanced expression. In the advanced expression, use the CASE "function" to create a variable that is 1 if your source variable is 2 or 3, 0 otherwise. Then, in your summary table task, drag ALLHIGH to the RIGHT of your current column variables, not above or below, and set the calculation to a sum. I think that'll work.
- Mark as New
- Bookmark
- Subscribe
- Mute
- RSS Feed
- Permalink
- Report Inappropriate Content
Hey TomKari, thanks SO much for your response. I have completed 2 out of the 3 thus far! I am having an issue, however, with #3---I have created my new query with the advanced expression and my percentages are correct for the "1's" but the "0"s are showing up in the summary table, which I do not need to show. I have worked with it for a couple of hours and still can't figure it out. Can you tell what I am doing wrong? I just wanted the "1" column.
Thanks again for your help! ![]()
CJ
- Mark as New
- Bookmark
- Subscribe
- Mute
- RSS Feed
- Permalink
- Report Inappropriate Content
Almost!
Instead of using your new variable as a classification variable, use it as an analysis variable. Put it beside your column variable, and make that statistic a sum instead of n (because it's always 0 or 1, a sum represents a count.) Here's a screen cap of my report designer (it looks funny because I have EG 4.1 at home, sigh!)
However, this will only get you the count. I didn't realize you needed the percentage for that variable, and I've got to admit I can't think of a way to get it. I'll keep thinking about it, and hopefully someone else will have a good idea.
One definite way to do it is with PROC REPORT, which is a VERY sophisticated reporting program in SAS, but I think that would be very challenging for someone new to SAS.
Tom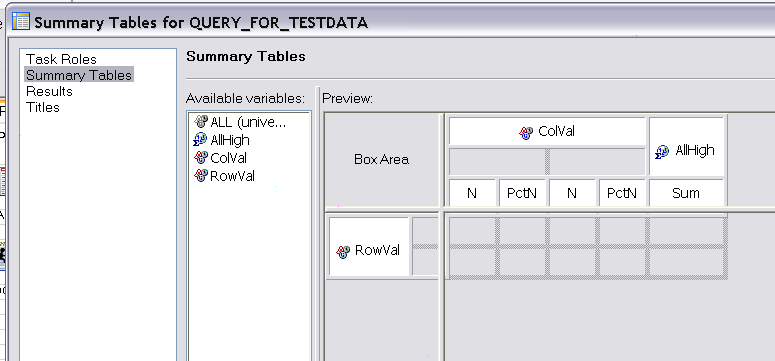

- Mark as New
- Bookmark
- Subscribe
- Mute
- RSS Feed
- Permalink
- Report Inappropriate Content
Hi,
can you post some data? Also, can you explain why the percentage values are the same on a given row?
For A School, Count values are different (4, 5, 6) but percentages the same (8.7, 8.7, 8.7).
For B School, Count values are the same as A School (4, 5, 6) but percentage values (7.7, 7.7, 7.7) not the same as percentage values for A School.
.jpg")
Catch up on SAS Innovate 2026
Nearly 200 sessions are now available on demand with the SAS Innovate Digital Pass.
Explore Now →Check out this tutorial series to learn how to build your own steps in SAS Studio.

Find more tutorials on the SAS Users YouTube channel.
SAS Training: Just a Click Away
Ready to level-up your skills? Choose your own adventure.
-
4 replies
-
06-20-2012 02:08 PM
-
4589 views
-
3 likes
-
3 in conversation
-
