- Home
- /
- Programming
- /
- Enterprise Guide
- /
- EGuide 5.1 and Vector Graphics in SAS 9.3
- RSS Feed
- Mark Topic as New
- Mark Topic as Read
- Float this Topic for Current User
- Bookmark
- Subscribe
- Mute
- Printer Friendly Page

- Mark as New
- Bookmark
- Subscribe
- Mute
- RSS Feed
- Permalink
- Report Inappropriate Content
I just attended SESUG and attended a couple of Sanjay Matange's talks about statistical graphics and the ability to use vector graphics that can be scaled ( Report from SESUG 2012 - Graphically Speaking ). However, I can't figure out the options to change in EGuide to get those kinds of graphs.
I don't want to save the task as a code template because then I lose a lot of the other power of EGuide. I can use the 'insert code' feature of a task if needed.
My ultimate goal is to be able to take a generated image, put it into PowerPoint, project it on an 10' screen, and have it look professional.
Has anyone done this before? What was the combination of ODS parameters that you used?
Thanks,
Doc Muhlbaier
Duke

- Mark as New
- Bookmark
- Subscribe
- Mute
- RSS Feed
- Permalink
- Report Inappropriate Content
Hi:
Look at this doc:
The above link is for SAS/GRAPH, using PRINTERPATH and/or DEV= depending on your destination.
Here's the link for ODS GRAPHICS (you use OUTPUTFMT in the ODS GRAPHICS statement):
I don't know whether SVG is surfaced in the drop down boxes in EG. You may have to use code.
cynthia
- Mark as New
- Bookmark
- Subscribe
- Mute
- RSS Feed
- Permalink
- Report Inappropriate Content
Cynthia,
I read the references you provided and they didn't help. They were too generic. There were 5 'printer' types and 8 graphic formats and no mention of PowerPoint or Office. I really didn't want to try 40 combinations to try to find one that works.
I don't really know much about using ODS; my use it totally a by-product of EGuide usage. I need a 'cook-book' approach here rather than a 'cooking principles' approach.
Maybe Chris knows the magic potion or you two can get Sanjay to post something to his graphics blog. And, hint, hint, this would be really nice as a point-and-click addition to EGuide 6.1.
Thanks,
Doc
- Mark as New
- Bookmark
- Subscribe
- Mute
- RSS Feed
- Permalink
- Report Inappropriate Content
Doc:
It was my understanding that the ODS Graphics Designer was going to be a menu button or task in EG 5.1 -- so if you're not finding it, perhaps you have to load it. I'll have to defer to Chris on this one.
As for SVG-- are you using EG tasks and wizards (which generate SAS/GRAPH code) or are you using ODS GRAPHICS (such as SGPLOT, SGPANEL, etc)? The method you choose will make a difference in how you set the device or image format to SVG.
Only the SAS Add-in for Microsoft Office specifically creates output for PowerPoint. So if you need SVG images that you can paste or insert into PowerPoint, do you know, for sure, that PowerPoint will open or insert SVG images?
For example, I used the first example (with the simple DEVICE=SVG) in this Tech Support note:
http://support.sas.com/kb/37/261.html
And, IE would not render the SVG, but Firefox did render the graphs. The HTML file would not open into PowerPoint. When I tried to insert the .SVG file into PowerPoint, I got a note that "The image cannot currently be displayed." -- which was a PPT message. Perhaps I need some plug-in with PPT to open an SVG file. Or some plug-in for Office because Word did not render the SVG file either.
Tech Support probably is the fastest route fo figure out your "cookbook" choices, if the code in the Tech Support note doesn't work for you. I still have my doubts about PPT and SVG. In this Wikipedia article Scalable Vector Graphics - Wikipedia, the free encyclopedia on SVG, it explains that IE does not have support for SVG until IE9 (which explains why I couldn't open the SVG in my browser, which is still IE 8). But, Microsoft Office is not listed in the section on "Software and support in applications", at the bottom of the article.
At any rate, here's the output rendered in Firefox in the attached screenshot.
cynthia

- Mark as New
- Bookmark
- Subscribe
- Mute
- RSS Feed
- Permalink
- Report Inappropriate Content
Thanks Cynthia. I guess I'll have to muddle along. We only have the Add In for Microsoft Excel, so I need to create a file type that is compatible with PowerPoint for manual insertion. The ODS Graphics Designer is not useful as I need to have program control of the file generation.

- Mark as New
- Bookmark
- Subscribe
- Mute
- RSS Feed
- Permalink
- Report Inappropriate Content
Doc,
Here's something you can try.
Create a program node with this code (as an example):
ods listing gpath='c:\temp' style=htmlblue;
ods graphics on / scale=on imagefmt=emf imagename='hist';
proc sgplot data=sashelp.cars;
histogram msrp;
density msrp;
run;
The GPATH option tells SAS where to put your graph files, and it's a SAS session file path. So if your SAS server is remote, you'll need to use a file path that you can get to later on that server (perhaps a network share).
The IMAGEFMT option is set to EMF, which PowerPoint likes and should scale well.
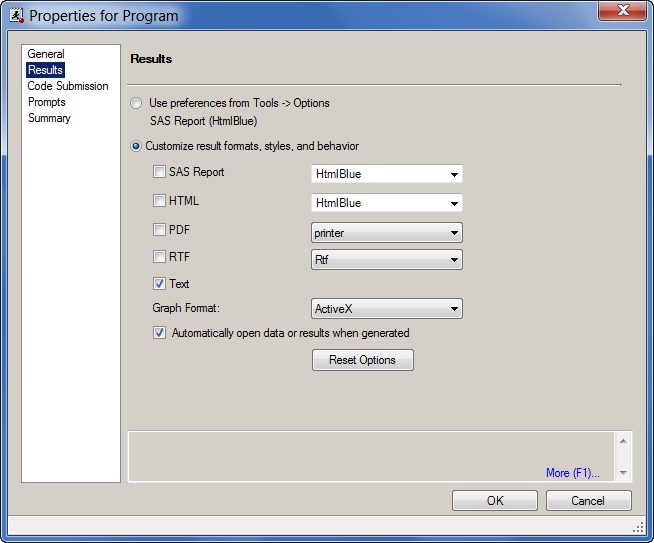
Before you run this program, click on the Properties icon in the program editor view (top right side of the toolbar on the top of the window). Change the results properties to override the output options (not use the app preferences) and select just Text as output. In this program, you're creating only charts and nothing else of interest, right?
Good luck!
Chris
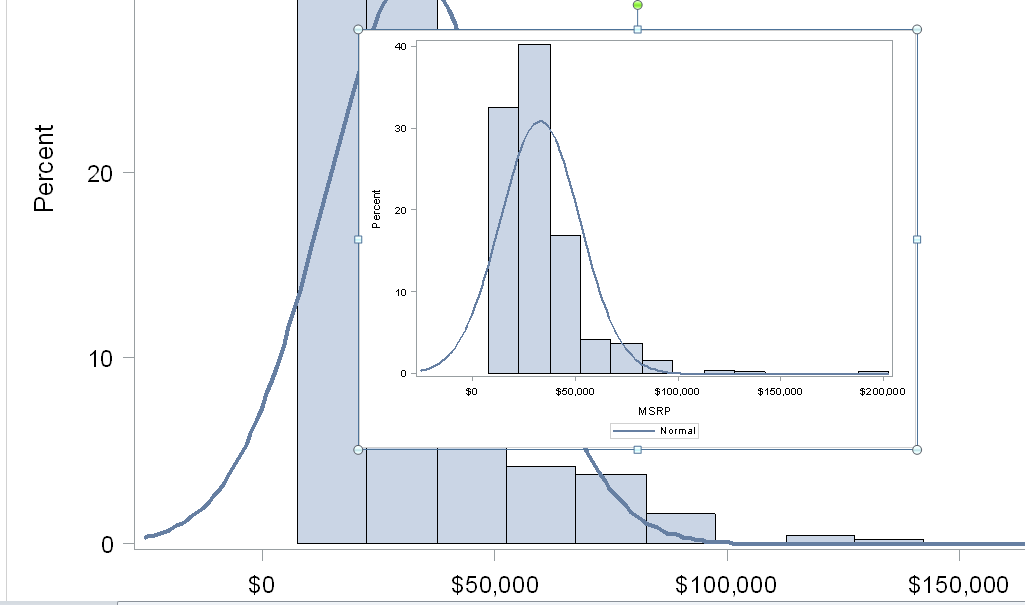
P.S. I attached a screen shot of the resulting image in PowerPoint. I inserted the same EMF file twice, then used PPT to size one of them down as inset to the other, and zoomed in. Hopefully you can see that the vector images scale clearly.

- Mark as New
- Bookmark
- Subscribe
- Mute
- RSS Feed
- Permalink
- Report Inappropriate Content
ODS Graphics Designer in EG 5.1: Tasks > Graph > Open ODS Graphics Designer.

Don't miss out on SAS Innovate - Register now for the FREE Livestream!
Can't make it to Vegas? No problem! Watch our general sessions LIVE or on-demand starting April 17th. Hear from SAS execs, best-selling author Adam Grant, Hot Ones host Sean Evans, top tech journalist Kara Swisher, AI expert Cassie Kozyrkov, and the mind-blowing dance crew iLuminate! Plus, get access to over 20 breakout sessions.
What’s the difference between SAS Enterprise Guide and SAS Studio? How are they similar? Just ask SAS’ Danny Modlin.

Find more tutorials on the SAS Users YouTube channel.
 Click image to register for webinar
Classroom Training Available!
Select SAS Training centers are offering in-person courses. View upcoming courses for:
-
6 replies
-
10-18-2012 03:42 PM
-
1509 views
-
3 likes
-
4 in conversation
-
