- Home
- /
- Programming
- /
- Enterprise Guide
- /
- Copying Output and Pasting in Excel - Top Row Not Perfectly Lining Up
- RSS Feed
- Mark Topic as New
- Mark Topic as Read
- Float this Topic for Current User
- Bookmark
- Subscribe
- Mute
- Printer Friendly Page

- Mark as New
- Bookmark
- Subscribe
- Mute
- RSS Feed
- Permalink
- Report Inappropriate Content
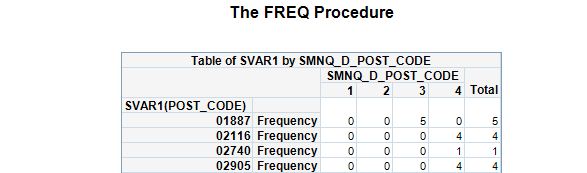
I am doing a very basic PROC FREQ such as the following:
proc freq data = SQUADS;
tables SVAR1 * SMNQ_D_POST_CODE
nopercent nocum norow nocol;
run;
The results look very normal:
And it usually looks pretty normal when I paste it into Excel:
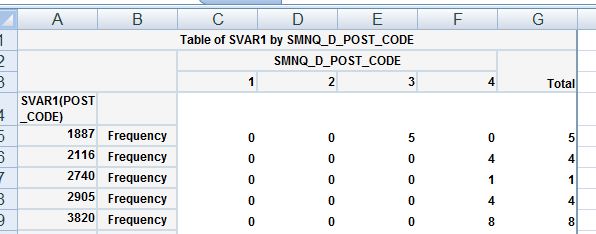
If I go to cell A5 (the 1887) then arrow on over to the right the first row of 0 0 5 0 5 lies on row 4 instead of row 5. Yes, this is a trifle in the grand scheme of things, but it is a little annoying.
Is this the result of how I have set up my output to look? I am open to any suggestions. For now I am just cognizant of this when I work between platforms.
Thank you.
Accepted Solutions

- Mark as New
- Bookmark
- Subscribe
- Mute
- RSS Feed
- Permalink
- Report Inappropriate Content
Options and methods vary depending on the version of SAS / Enterprise Guide.
Generally instead of Proc Freq I would look to either Proc Report or Proc Tabulate for similar output as those procedures allow overrides and additional options such as text alignment, weight, font size and host of other appearance options. Or direct the Proc Freq output to a data set and use Proc Print with also allows more appearance controls.
Put I would start with a simple ODS output and see if the results are satisfactory.
- Mark as New
- Bookmark
- Subscribe
- Mute
- RSS Feed
- Permalink
- Report Inappropriate Content
More the behavior of copy from HTML and paste into Excel in general. What has happened is that in the paste the text vertical alignment is top. The cells are merged vertically so they appear in the wrong row. Options are to manually align the text vertically after pasting or use an approach that doesn't paste but generates a more appropriate Excel formatted document such as ODS tagsets.excelxp.
- Mark as New
- Bookmark
- Subscribe
- Mute
- RSS Feed
- Permalink
- Report Inappropriate Content
Thank you very much. I did a little investigating using the ODS tagsets.excelxp recommendation you provided. I am thinking it probably would be easiest to simply create the output in such a way so that it is .csv.
Is there an option to select in EG that would enable this? Or do I need to go through the processes of downloading the proper program/functionality and write the extra code?
Trying to keep as simple as possible.
Thank you.
- Mark as New
- Bookmark
- Subscribe
- Mute
- RSS Feed
- Permalink
- Report Inappropriate Content
Options and methods vary depending on the version of SAS / Enterprise Guide.
Generally instead of Proc Freq I would look to either Proc Report or Proc Tabulate for similar output as those procedures allow overrides and additional options such as text alignment, weight, font size and host of other appearance options. Or direct the Proc Freq output to a data set and use Proc Print with also allows more appearance controls.
Put I would start with a simple ODS output and see if the results are satisfactory.
- Mark as New
- Bookmark
- Subscribe
- Mute
- RSS Feed
- Permalink
- Report Inappropriate Content
Thank you so much!!! I believe it is the former SPSS-er in me that realy wanted proc freq to work. I will try all of those suggestions.

- Mark as New
- Bookmark
- Subscribe
- Mute
- RSS Feed
- Permalink
- Report Inappropriate Content
One more thing you might look at: the LIST option on the TABLES statement. The output will be cleaner, but oriented differently.
tables origin * type / nopercent nocum norow nocol LIST;
run;
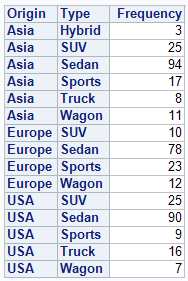
Chris
- Mark as New
- Bookmark
- Subscribe
- Mute
- RSS Feed
- Permalink
- Report Inappropriate Content
Thank you for all of the suggestions!
.jpg")
Catch up on SAS Innovate 2026
Nearly 200 sessions are now available on demand in the Innovate Hub.
Watch Now →Check out this tutorial series to learn how to build your own steps in SAS Studio.

Find more tutorials on the SAS Users YouTube channel.
SAS Training: Just a Click Away
Ready to level-up your skills? Choose your own adventure.
-
6 replies
-
05-05-2015 10:36 AM
-
6412 views
-
6 likes
-
3 in conversation
-
