- Home
- /
- Programming
- /
- Enterprise Guide
- /
- Bubble Color Variation
- RSS Feed
- Mark Topic as New
- Mark Topic as Read
- Float this Topic for Current User
- Bookmark
- Subscribe
- Mute
- Printer Friendly Page

- Mark as New
- Bookmark
- Subscribe
- Mute
- RSS Feed
- Permalink
- Report Inappropriate Content
Hello SAS/GRAPH and chart users,
I am using three variables to generate this bubble chart: year, month, price
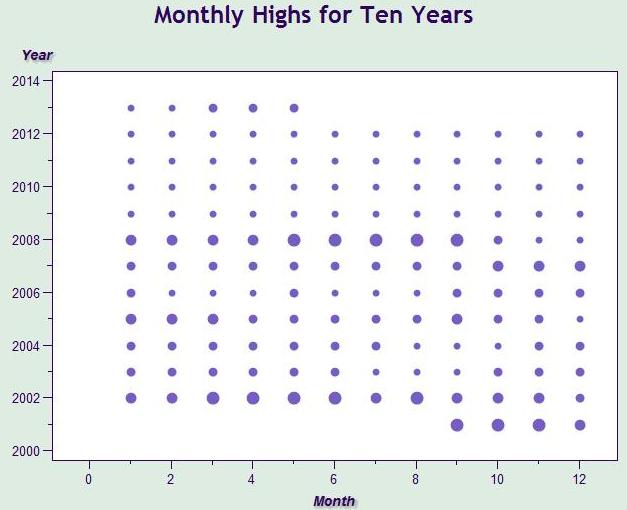
Is it possible to control color of these bubbles depending on size? For instance have two categories - blue for big and pink for little ones?
Thankfully,
Dhanashree Gadkari

- Mark as New
- Bookmark
- Subscribe
- Mute
- RSS Feed
- Permalink
- Report Inappropriate Content
I haven't used a bubble chart in SAS. Have you checked the SAS web site to see what options are available for this version of proc gplot?
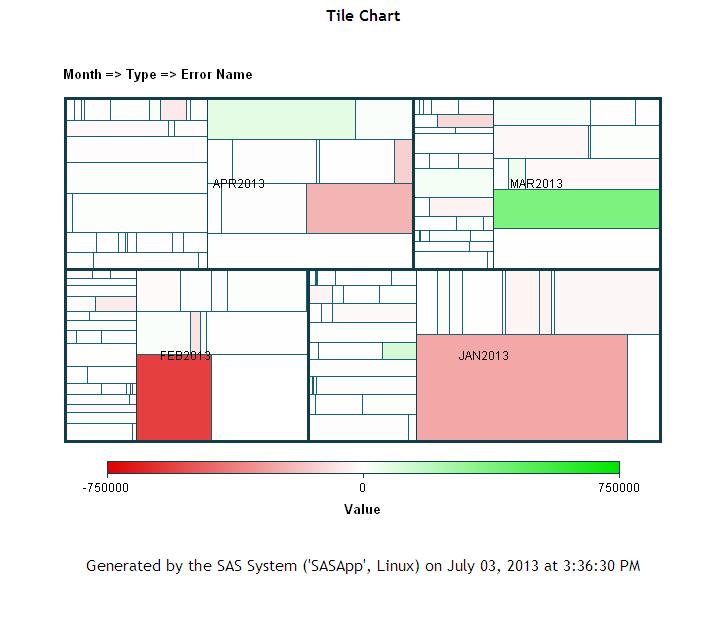
It would be a different chart type, but you could use the 'tile chart'. EG will let you set multiple colors and it blends them together based on your values. I've attached an example I made when I was testing it out a few months ago.
A bonus feature of the tile chart is that in the html format you can drill down. so you could start with tiles by year, then drill into a year and see the months in greater detail.
- Mark as New
- Bookmark
- Subscribe
- Mute
- RSS Feed
- Permalink
- Report Inappropriate Content
I guess there is no way to control color variation in bubble statement. There is BFILL=gradient option for generating gradient-filled bubbles.
By default, the JAVA and ActiveX devices create solid bubbles.
BFILL=GRADIENT starts with the current axis area color and gradually transitions to the color specified with the BCOLOR= option or the color of the current style. If you are using an ODS style, the colors are controlled by the startcolor and endcolor attributes of the TwoColorAltRamp style element.
Note:The SAS/GRAPH ActiveX control displays negative values as empty circles.
However my setup is not displaying gradience. I am currently using Ocean ods html style with ActiveX for Graph as my Tools->Options settings. Changing this to JPEG or non-Java and non-ActiveX, gives me compile time errors.
I am looking for something similar to LEVELS option provided for chrono statement in maps.
Mr. Chris, can you share gplot step for tile chart you generated above; it might clear haze in deciding if this kind of chart can help out. Thank you so much.
- Mark as New
- Bookmark
- Subscribe
- Mute
- RSS Feed
- Permalink
- Report Inappropriate Content
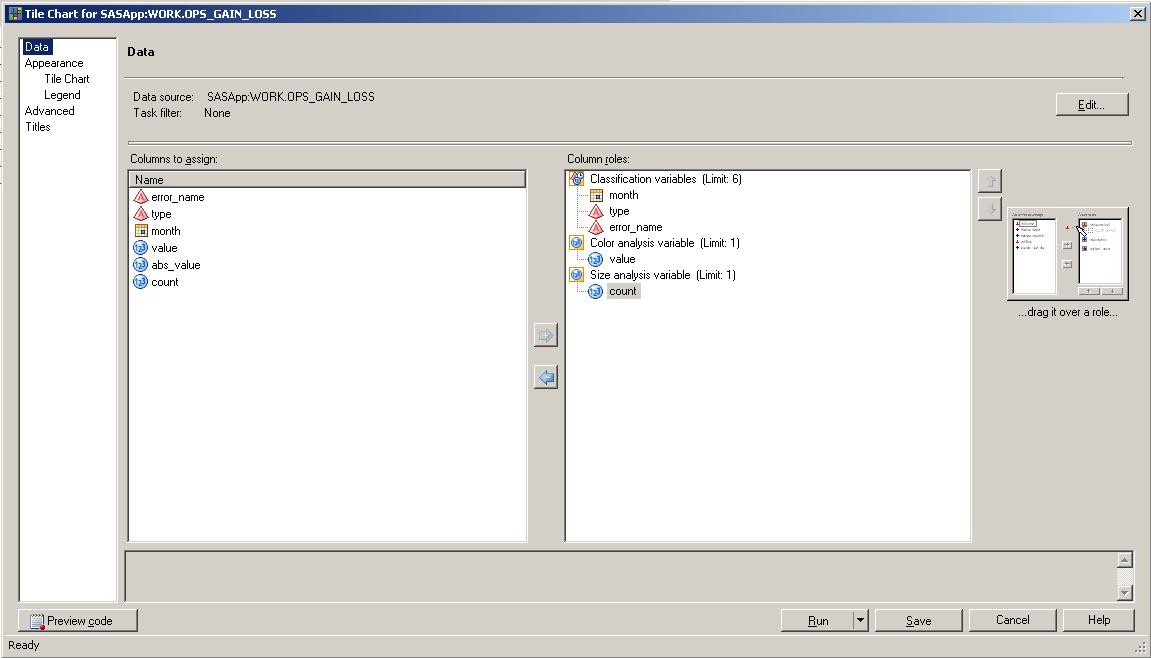
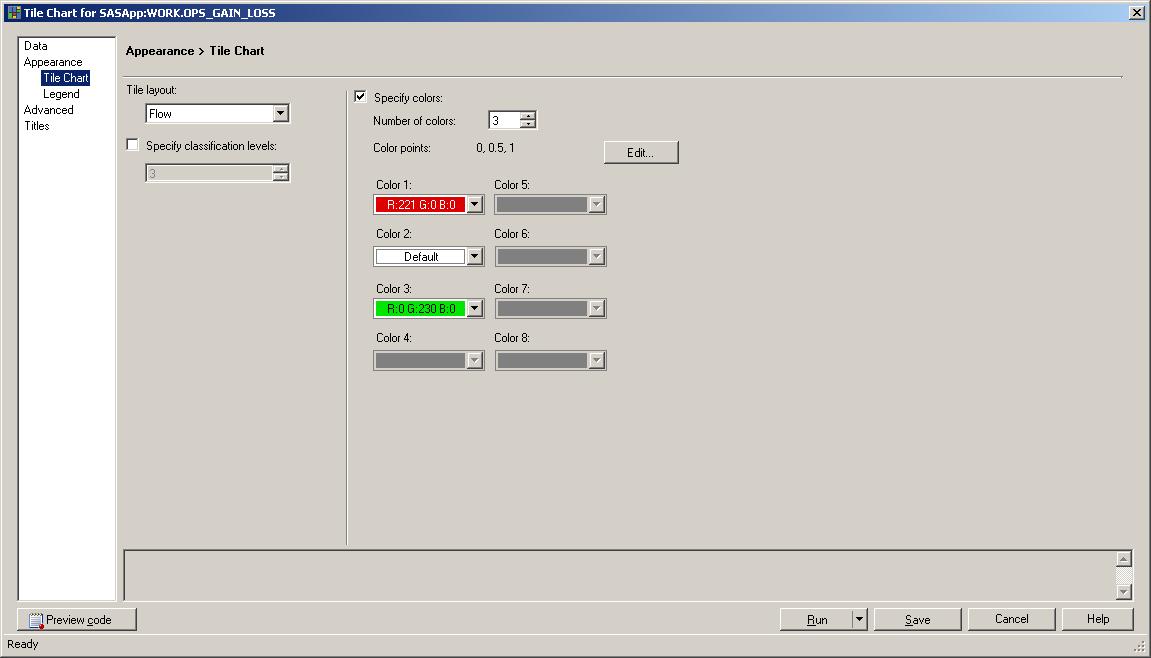
Sure. I'll copy in some screenshots to show what I did. The task is part of the 'graph' group (which uses PROC GTILE I believe).
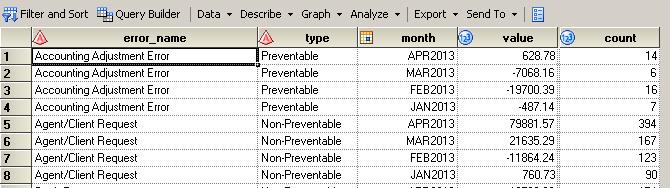
The setup of the data is very important. The classification variables (the drill down groupings) must be set up so that you can follow that same hierarchy in the data. In my example, I start with 4 groups by month, then drill into two error types (preventable and non-preventable), and finally the information at its most granular level is in groups of error names. So there needs to be a record in your data set for each month/error type/error name grouping.
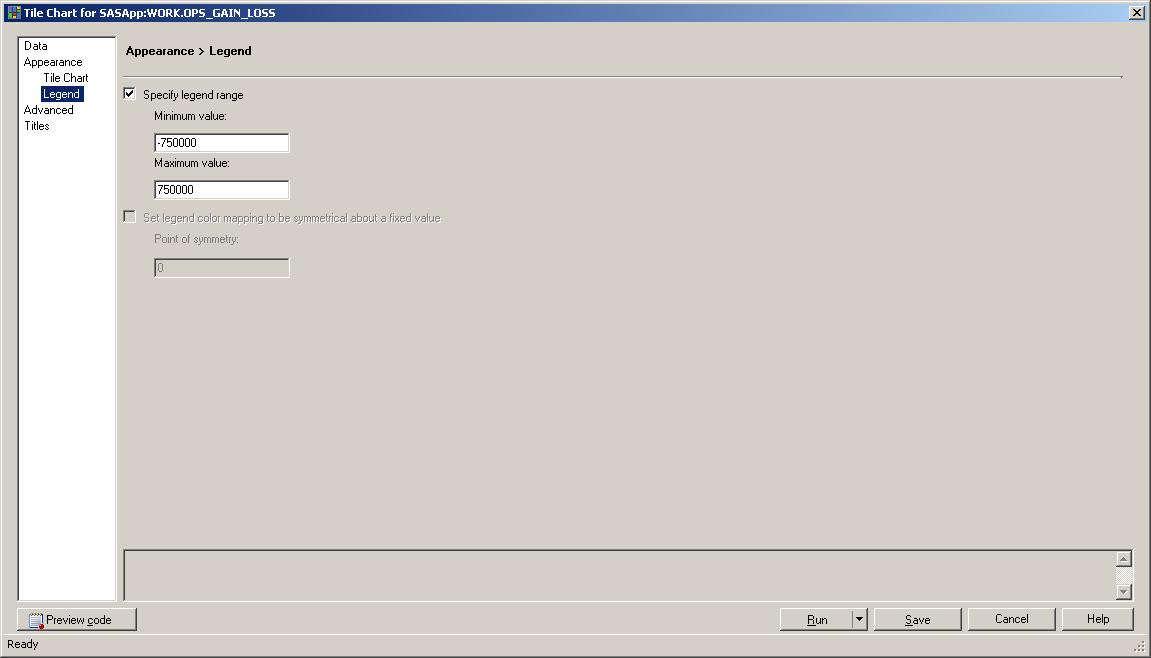
Then here are the ways I set up the task. I chose 3 colors, negative values in red transitioning to positive values in green with a white transition color in the middle (in this case, there are extreme values, most of the data is close to the midpoint, therefore much of my chart is white unfortunately.) Then I chose max and min values of the same absolute value so that the chart would have a symmetric range around zero (in reality, the positive and negative sides were unbalanced and by default SAS made the midpoint for the colors approx -100k).
- Mark as New
- Bookmark
- Subscribe
- Mute
- RSS Feed
- Permalink
- Report Inappropriate Content
ok.. thank you. this was quite enlightening.
.jpg")
Catch up on SAS Innovate 2026
Nearly 200 sessions are now available on demand in the Innovate Hub.
Watch Now →Check out this tutorial series to learn how to build your own steps in SAS Studio.

Find more tutorials on the SAS Users YouTube channel.
SAS Training: Just a Click Away
Ready to level-up your skills? Choose your own adventure.
-
4 replies
-
07-03-2013 12:54 PM
-
3153 views
-
3 likes
-
2 in conversation
-
