- Home
- /
- Analytics
- /
- SAS Data Science
- /
- True Positive is 0. Oversampling, adjusted prior, weight. Need a help...
- RSS Feed
- Mark Topic as New
- Mark Topic as Read
- Float this Topic for Current User
- Bookmark
- Subscribe
- Mute
- Printer Friendly Page

- Mark as New
- Bookmark
- Subscribe
- Mute
- RSS Feed
- Permalink
- Report Inappropriate Content
Hi All,
I have a dataset with very small response rate (0.0057 or 0.57%), so I did oversampling method using several percentages from 8% to 50%. I added decision nodes after sample nodes, and changed prior probably to my original prior probably which is 0.0057 for primary and 0.9943 for secondary. I also changed weights by clicking "Default with Inverse Prior Weights". My ASE or Misclassification rates went up as I increased my sample size from 8% to 50%.
My concern is the number of True Positive in my Model Comparison node. They are all smaller than 10 regardless of my sampling or models (decision tree, Neural, logistic Regression, etc.). After cleaning up my data, I have over 1 million rows (6445 for primary and the rest is secondary).
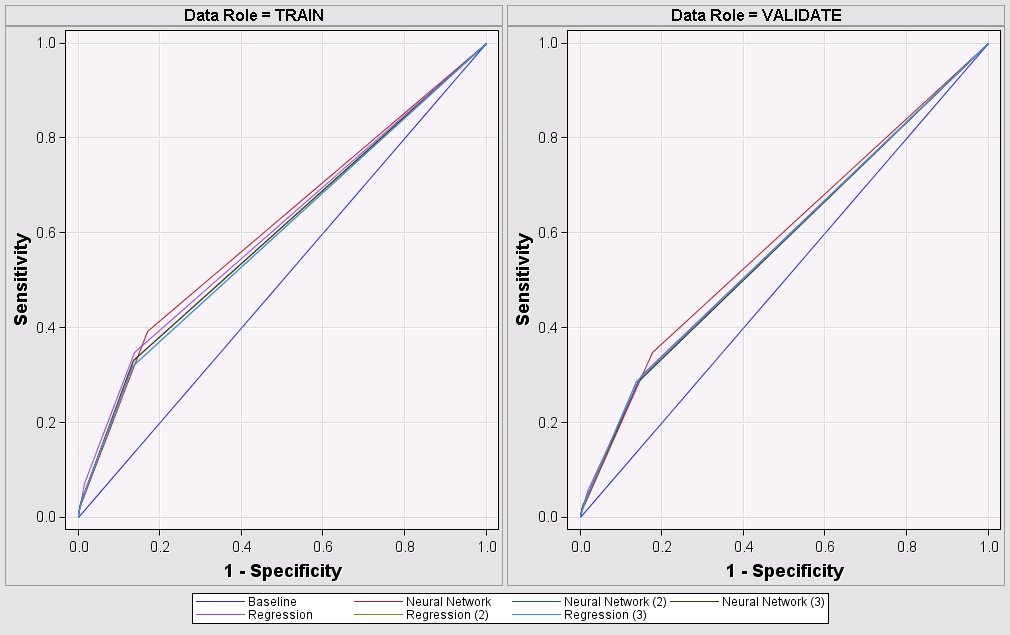
How can I do to improve my model or how should I make a decision about which model is the best if the number of True Positive is all less than 10 – many models are zeroes. Also, my ROC charts are not curved (see below).
I really appreciate for any advise.
Event Classification Table
Model Selection based on Valid: Average Profit for RESPONSE_IND (_VAPROF_)
Model Data False True False True
Node Model Description Role Target Negative Negative Positive Positive
Reg Regression TRAIN RESPONSE_IND 3223 29002 0 0
Reg Regression VALIDATE RESPONSE_IND 3222 29003 0 0
Reg2 Regression (2) TRAIN RESPONSE_IND 3222 29002 0 1
Reg2 Regression (2) VALIDATE RESPONSE_IND 3222 29003 0 .
Reg3 Regression (3) TRAIN RESPONSE_IND 3222 29002 0 1
Reg3 Regression (3) VALIDATE RESPONSE_IND 3222 29003 0 .
Neural3 Neural Network (3) TRAIN RESPONSE_IND 3223 29002 0 0
Neural3 Neural Network (3) VALIDATE RESPONSE_IND 3222 29003 0 0
Neural2 Neural Network (2) TRAIN RESPONSE_IND 3223 29002 0 0
Neural2 Neural Network (2) VALIDATE RESPONSE_IND 3222 29003 0 0
Neural Neural Network TRAIN RESPONSE_IND 3223 29002 0 0
Neural Neural Network VALIDATE RESPONSE_IND 3222 29003 0 0

- Mark as New
- Bookmark
- Subscribe
- Mute
- RSS Feed
- Permalink
- Report Inappropriate Content
Hi KKasahar,
It seems to me that you are on the right path. Your ROC plots will be more curved when you get better models. Remember that sensitivity is a true positive rate and specifity is a true negative rate.
Some ideas to get better models. Have you tried ensembles? Try a few of the below.
a) Gradient Boosting. Warning: it is going to take a while to run. Run a default Gradient Boosting node right after your data, no partition, no variable selection just your data, and Gradient Boosting, what happens?
b) Try the ensemble of Reg2 and Reg3 using the Ensemble node
c) Use ensembles like bagging as described in this paper: http://support.sas.com/resources/papers/proceedings14/SAS133-2014.pdf
For anyone else reading this thread, I found a quick scoop of a rare event approach and some links to a longer answer and video.
To create a flow that depicts a rare event case analysis in the SAS Enterprise Miner, complete the following steps:
- Create the data source. Define a target variable.
- To over-sample the rare event, add a Sample node, and attach it to the Input Data node. Set the Sample Method property to Stratify.
- Click the ... (ellipsis) button beside the Variables property, and choose your target variable as the stratification variable.
- In the Stratified property section, set the Criterion property to Equal. This setting causes the sample to use all of the event observations, and an equal number of randomly selected non-event observations. Set the Oversampling Adjust Frequency property to no.
For a beefier answer
Read here http://support.sas.com/kb/24/205.html
Find a video here http://support.sas.com/kb/34/270.html (video in the link when you click See the attached video for a demonstration)
I hope this helps!
Miguel
- Mark as New
- Bookmark
- Subscribe
- Mute
- RSS Feed
- Permalink
- Report Inappropriate Content
Hi Miguel,
I really appreciate your advice. Below is the result of your suggestions:
A) Gradient Boosting. (Data -> Gradient Boosting)
Result:
| Model | Misclassification rate | ASE | ROC | Gini Coef. | ||
| Y | Boost | Gradient Boosting | 0.005701214 | 0.00566871 | 0.5 | 0 |
Model | Model Description | Data Role | Target | FALSE Negative | TRUE Negative | FALSE Positive | TRUE Positive |
Node | |||||||
Boost | Gradient Boosting | TRAIN | RESPONSE_IND | 6445 | 1124016 | 0 | 0 |
This model classified all cases as non-response – just like other models that I built – because my response rate is (0.0057 or 6445 cases) and non-response is (0.9943 or 1124016) and True Positive and False Positive are both zero.
B) Ensemble of Reg2 and Reg3 (using 10% oversampled data)
Selected Model | Model Node | Valid: Average Profit for RESPONSE_IND | Train: Average Squared Error | Train: Misclassification Rate | Valid: Average Squared Error | Valid: Misclassification Rate |
Y | Reg2 | 1.71 |
|
|
|
|
Reg3 | 1.71 |
|
|
|
| |
Ensmbl | 1.71 |
|
|
|
|
C) Bagging, Boosting, and Rotation Forest.
This paper you suggested me is great!! I am still working on this part since I have not used these methods. I will let know.
Findings from my search ( I am not sure how reliable they are)
I was reading SAS support page and they said, “Over-weighting or under-sampling can improve predictive accuracy when there are three or more classes, including at least one rare class and two or more common classes.” My data has two classes, so I guess it is true for my case because my oversampling (omitting cases from common classes) is not helping to obtain the best model regardless of sample sizes. However, when I don't put adjusted prior (using the prior of sample data), my misclassifications increases as I increase sample size as well as the number of True Positive. I care more about the number of True Positive rather than errors. Is it wrong if I keep current prior probablity(not using adjusted prior)?
Below is the link to the website.
The other thing is how to evaluate models when you need to detect the rare event.
- Detection rate (Recall) - ratio between the number of correctly detected rare events and the total number of rare events
- False alarm (false positive) rate – ratio between the number of data records from majority class that are misclassified as rare events and the total number of data records from majority class.
- ROC Curve is a trade-off between detection rate and false alarm rate
so Missclassification, ASE, Average Profit , etc are not sufficient metric for evaluation when rare event??
Here is the title of article:
"Data Mining for Analysis of Rare Events:
A Case Study in Security, Financial and
Medical Applications"
Thanks, Miguel! I really appreciate your help.

Don't miss out on SAS Innovate - Register now for the FREE Livestream!
Can't make it to Vegas? No problem! Watch our general sessions LIVE or on-demand starting April 17th. Hear from SAS execs, best-selling author Adam Grant, Hot Ones host Sean Evans, top tech journalist Kara Swisher, AI expert Cassie Kozyrkov, and the mind-blowing dance crew iLuminate! Plus, get access to over 20 breakout sessions.
Use this tutorial as a handy guide to weigh the pros and cons of these commonly used machine learning algorithms.

Find more tutorials on the SAS Users YouTube channel.
-
2 replies
-
05-07-2014 03:12 PM
-
3508 views
-
5 likes
-
2 in conversation
-
