- Home
- /
- Analytics
- /
- SAS Data Science
- /
- Survival in EM - Recreate Curves on Scored Data?
- RSS Feed
- Mark Topic as New
- Mark Topic as Read
- Float this Topic for Current User
- Bookmark
- Subscribe
- Mute
- Printer Friendly Page

- Mark as New
- Bookmark
- Subscribe
- Mute
- RSS Feed
- Permalink
- Report Inappropriate Content
I have successfully built a survival model in EM which has a K-S of 30 in both Train, Valid, and Test. So I assume the model is pretty good.
Here are some facts about it:
- built it on a sample of 500K obs
- unexpanded data
- no time vary-ing covariates
- Forecasting 36 month-intervals
- Customer base ranges from tenure of 0 months to 250 months
- No truncation
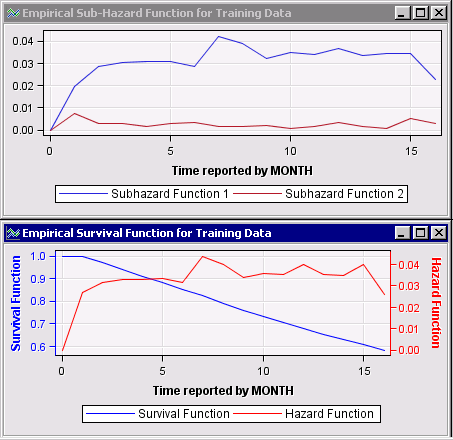
The curves drawn by the Node Results are very nice. I can see hazard spikes during months that make sense (at 3,12,24,48 months). The survival curve also look nice, it descends as I'd expect.
However, now that I've scored the data, I'd like to replicate these curves by querying the results. However when I try - the curves look vastly different. When I graph _t_ (tenure of customer) vs Avg(EM_SURVEVENT) - my curve looks weird, in fact it even increases along the way!
Is there something wrong with the way I am trying to recreate these charts?
I tried graphing instant risk and subhazard functions against _T_ and it also did not match the model graphs, so I'm afraid there is something wrong.
Source of Model Curve: SAS Survival Node => Results => click chart => Tables button at top of screen
Source of Scored Curve:
SELECT _T_ AS RELATIVE_TENURE, AVG(1-((EM_SURVIVAL-EM_SURVFCST)/EM_SURVIVAL)) AS S
FROM [Scored Results]
GROUP BY _T_;

- Mark as New
- Bookmark
- Subscribe
- Mute
- RSS Feed
- Permalink
- Report Inappropriate Content
Hey JBerry,
Not sure I get the second part, specially instant risk. But I am no expert in survival analysis. I use this node a lot, mostly to get hazard functions, but I am still very low on the learning curb.
It sounds to me like you were trying to get the survival function?
If I was to redo the survival function in EM, I would add something like the below in the SAS Code node. Notice that your survival node creates a dataset _ehcendata which summarizes events, event dates, and _y_.
You can use that to get the curves you were looking for.
Add the below in a SAS code node and connect it to your Survival node.
data ehcendata;
set &EM_LIB..&EM_METASOURCE_NODEID._ehcendata;
run;
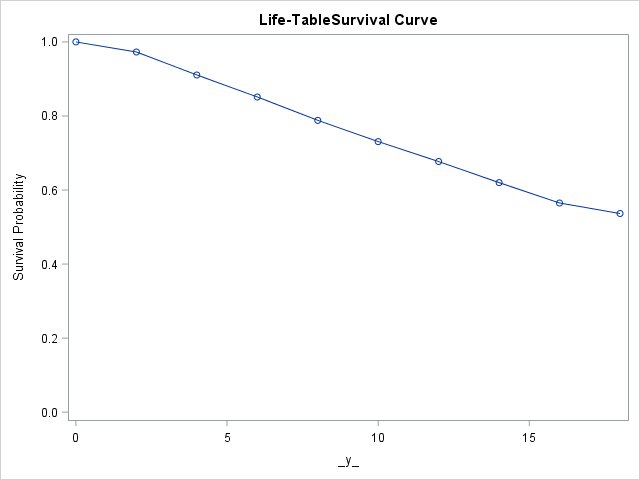
proc lifetest data=ehcendata method=LT;
time _y_*event(0);
run;
If you did it in base SAS you would also get the plots (change em_lib for your workspace and em_metasource_nodeid for your survival node ID).

Don't miss out on SAS Innovate - Register now for the FREE Livestream!
Can't make it to Vegas? No problem! Watch our general sessions LIVE or on-demand starting April 17th. Hear from SAS execs, best-selling author Adam Grant, Hot Ones host Sean Evans, top tech journalist Kara Swisher, AI expert Cassie Kozyrkov, and the mind-blowing dance crew iLuminate! Plus, get access to over 20 breakout sessions.
Use this tutorial as a handy guide to weigh the pros and cons of these commonly used machine learning algorithms.

Find more tutorials on the SAS Users YouTube channel.
-
1 reply
-
07-02-2015 05:48 PM
-
1000 views
-
0 likes
-
2 in conversation
-
