- Home
- /
- Analytics
- /
- SAS Data Science
- /
- Need help with simple pattern discovery in Enterprise Miner
- RSS Feed
- Mark Topic as New
- Mark Topic as Read
- Float this Topic for Current User
- Bookmark
- Subscribe
- Mute
- Printer Friendly Page
- Mark as New
- Bookmark
- Subscribe
- Mute
- RSS Feed
- Permalink
- Report Inappropriate Content
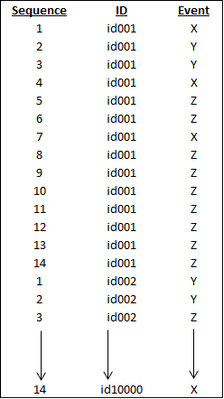
I am having trouble performing a “version” of pattern discovery with SAS Enterprise Miner. I have a data set with the following basic structure:
The customer (ID) has 14 days (Sequence) to perform one of 3 events X, Y, or Z (Event), where one of the three events must be performed on each sequence. I would simply like to figure out the most likely outcomes, but i think there are too many combinations to code this out in base sas. I’m hoping for a table that might look like the following:
(as in, 15% of the observations follow the first one, 12% of observations follow the second, etc.)
I’m somewhat inexperienced with SAS EM and its options (I do most of my work in EG). I’ve been trying to figure this out with the Association Node (sequence option) and the Path Analysis Node, but they seem to produce results that are not quite what I need, which is to keep event occurrence strictly ordered 1 thru 14 (the results from these nodes don’t keep ‘chain item 1’ on sequence 1, ‘chain item 2’ on sequence 2, etc. - and the max chain items is only 10).
Any ideas?
Thanks
Accepted Solutions
- Mark as New
- Bookmark
- Subscribe
- Mute
- RSS Feed
- Permalink
- Report Inappropriate Content
If I understand what you want correctly, which I may not, you could do this without EM.
Transpose your data (Task) from long to wide.
Create a calculated column that is the concatenation of all events, ie Catx(of event1-event14)
Then run a frequency on that variable.
If you want to keep your variables separate you can run a freq like below. You may need to play around with the freq options to get your exact percent calculation or do it in a second step.
proc freq data=flipped;
table event1*event2*event3*...Event14 / LIST OUTPCT;
run;- Mark as New
- Bookmark
- Subscribe
- Mute
- RSS Feed
- Permalink
- Report Inappropriate Content
I had a strong feeling I was overcomplicating things. Then Reeza came along and proved it. Your suggestion works perfectly. Thank you!
Don't miss out on SAS Innovate - Register now for the FREE Livestream!
Can't make it to Vegas? No problem! Watch our general sessions LIVE or on-demand starting April 17th. Hear from SAS execs, best-selling author Adam Grant, Hot Ones host Sean Evans, top tech journalist Kara Swisher, AI expert Cassie Kozyrkov, and the mind-blowing dance crew iLuminate! Plus, get access to over 20 breakout sessions.
Use this tutorial as a handy guide to weigh the pros and cons of these commonly used machine learning algorithms.
Find more tutorials on the SAS Users YouTube channel.


