- Home
- /
- Analytics
- /
- SAS Data Science
- /
- Re: Is cut off node should still be used when boosting/ensemble models...
- RSS Feed
- Mark Topic as New
- Mark Topic as Read
- Float this Topic for Current User
- Bookmark
- Subscribe
- Mute
- Printer Friendly Page

- Mark as New
- Bookmark
- Subscribe
- Mute
- RSS Feed
- Permalink
- Report Inappropriate Content
Hi All,
For a classification problem with skewed target class 2%:98% == Y:N, I am using some standard data manipulations (transformations, replacements etc) followed by regression node and decision tree, enclosed between the start and end groups. I have selected the boosting procedure for 20 iterations for both the modeling nodes. The model comparison now selects boosted trees as the best model.
I have a doubt on whether cut off node still needs to be used post model comparison, given the fact that boosted trees work on minimizing the error rate from successive iterations through resampling. Is this resampling done with replacement as well?
Thanks in advance for your comments/views.
Regards,
Aditya.

- Mark as New
- Bookmark
- Subscribe
- Mute
- RSS Feed
- Permalink
- Report Inappropriate Content
Hi Aditya,
Just to double check, when you say you have regression, and decision tree, enclosed between start groups and end groups nodes for boosting, you mean each of your model nodes has its own pair of start group and end group nodes, correct?
You may also be aware that a strength of tree ensembles is that you do not need to data manipulations. Trees handle well missing values, and you could run into a case where imputing or replacing hurts your model.
I remember seeing some research where they recommend ensembles of regressions with stepwise selection turned on. You might also want to try that.
Regarding the cutoff node question, the cutoff assessment helps you assess the predicted event probability. The iterative nature of gradient boosting does not really affect this extra analysis. As long as you have a good model that separates well your two populations (event vs non-event), moving your cutoff is likely to give you better chance of maximizing your true positives.
Boosting does sample with replacement.
I hope it helps,
Miguel
- Mark as New
- Bookmark
- Subscribe
- Mute
- RSS Feed
- Permalink
- Report Inappropriate Content
Hi Miguel,
Appreciate your response to my queries from the earlier post.
I am using 2 seperate start and end group combinations one each for decision tree and other for stepwise logistic regression. The model comparison selects boosted trees as the best model.
The inherent mechanism of generating ensembles could be used to skip the usage of cut off node.
One last question would be, what is the difference between boosting through start and end groups vis a vis gradient boosting, in simplest sense as far as possible?
Thank you for your valuable comments once again.
Regards,
Aditya.
- Mark as New
- Bookmark
- Subscribe
- Mute
- RSS Feed
- Permalink
- Report Inappropriate Content
Hi Aditya,
Boosting procedures calculate the residuals as the derivatives of a loss function.
The Gradient Boosting node, with proc treeboost behind the scenes, uses a stochastic gradient function as a loss function. The boosting from Start Groups node uses SAS code to calculate a cumulative loss function.
In other words, the main difference is that Gradient Boosting node has a more modern loss function.
What do you mean when you say that ensembles let you skip the usage of a cutoff node? It seems to me that you use a Cutoff node if you are interested in a better assessment of your predicted probabilities. But this would be true for any model node, regardless of whether it is an ensemble. Am I missing something? Please briefly explain if you have a chance.
Thanks,
Miguel
- Mark as New
- Bookmark
- Subscribe
- Mute
- RSS Feed
- Permalink
- Report Inappropriate Content
Hi Miguel,
Thanks for clarifying the difference between standard boosting and gradient boosting. This is somehow not apparent in the SAS EMiner Help Menu, hence wanted to check the same for my understanding.
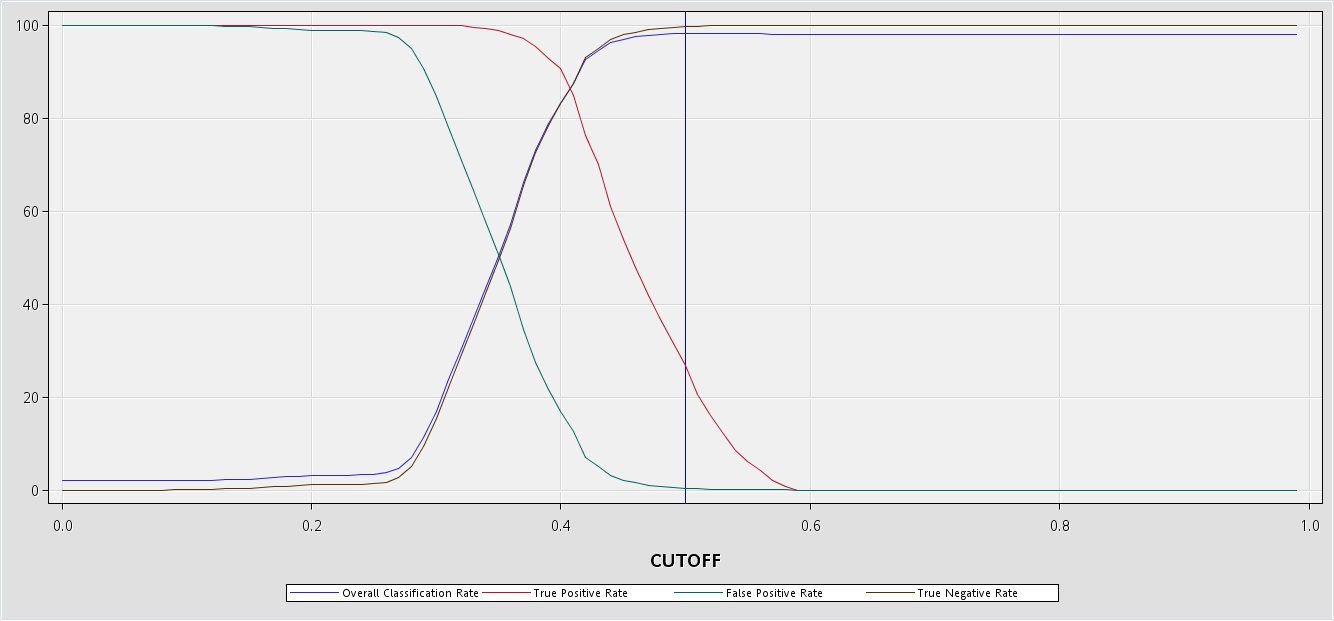
Referring to the example in my earlier post, I ran 2 models (LR and DT) seperately with 2 pairs of start and end group nodes followed by a model comparison, which selects boosted trees as the best model. No. of iterations was set to 20. The confusion about using cut off came from the following observation: Cut off node is then run after the model comparison node in the same diagram and the results were examined. The original/prior probabilities for Y:N are 2%:98% respectively. Hence at the cut off threshold of 0.02, I found that all the cases were either classified as true positives or false positives, with zero count for true negatives and false negatives. Also the TP rate (which is shown as a graph along with overall classification rate etc) at each cut off was 100% for about 0.3 or 0.4.
Hence, I was asking for whether the cut off node is still to be used even when I am working with ensembles. Also, I havent visited any literature where ensembles followed by comparison node and cut off node was illustrated in detail.
Do let me know your views on the same. And thanks a lot for your support to my queries, once again.
Regards,
Aditya.
- Mark as New
- Bookmark
- Subscribe
- Mute
- RSS Feed
- Permalink
- Report Inappropriate Content
What about the precision recall cutoff curve in your Cutoff node results, what does it look like?
- Mark as New
- Bookmark
- Subscribe
- Mute
- RSS Feed
- Permalink
- Report Inappropriate Content
Hi Miguel,
Please find attached the precision recall curve and cut off graphical outputs. Do let me know your views on the same.
Thanks,
Aditya. 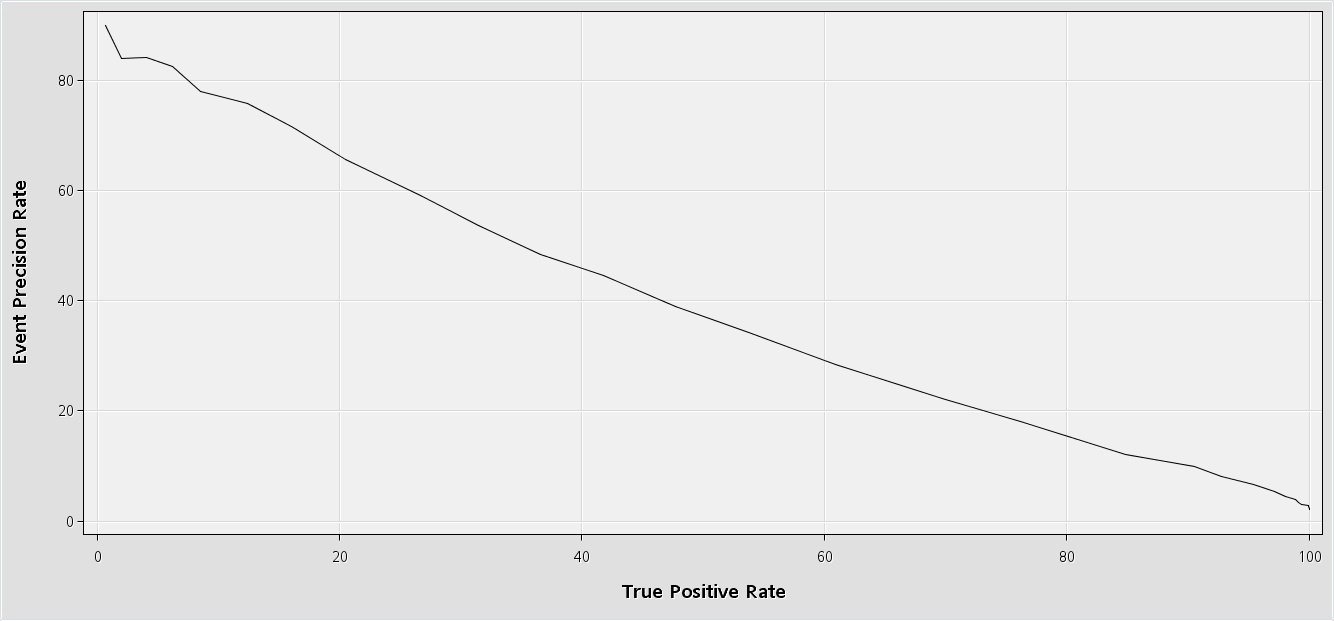

Don't miss out on SAS Innovate - Register now for the FREE Livestream!
Can't make it to Vegas? No problem! Watch our general sessions LIVE or on-demand starting April 17th. Hear from SAS execs, best-selling author Adam Grant, Hot Ones host Sean Evans, top tech journalist Kara Swisher, AI expert Cassie Kozyrkov, and the mind-blowing dance crew iLuminate! Plus, get access to over 20 breakout sessions.
Use this tutorial as a handy guide to weigh the pros and cons of these commonly used machine learning algorithms.

Find more tutorials on the SAS Users YouTube channel.
-
6 replies
-
06-11-2014 12:32 AM
-
1540 views
-
0 likes
-
2 in conversation
-
