- Home
- /
- Analytics
- /
- SAS Data Science
- /
- Re: How to interpret SAS Enterprise Miner results?
- RSS Feed
- Mark Topic as New
- Mark Topic as Read
- Float this Topic for Current User
- Bookmark
- Subscribe
- Mute
- Printer Friendly Page

- Mark as New
- Bookmark
- Subscribe
- Mute
- RSS Feed
- Permalink
- Report Inappropriate Content
Hello,
I started using SAS EM not a long time ago. I know how to import and modify data, build basic models etc.
But I couldn't find anywhere how to interpret results generated by models.
However, I'm thinking about interpreting it in simple words.
For example if I have target data in range 1-5 (1 the worst, 5 the best) I've chosen ordinal as datatype and now I have results as follows:
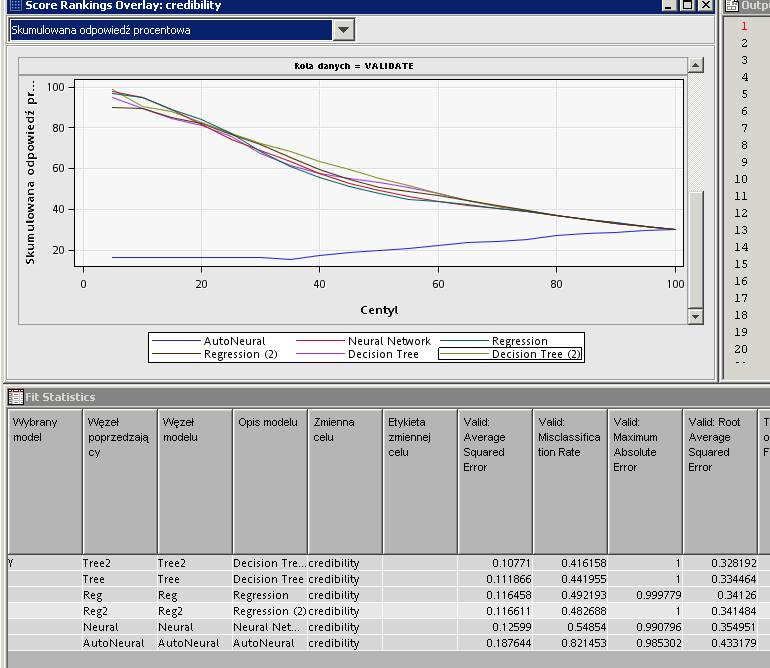
I know that the best model is Tree2, chosen on the basis of Valid: ASE , but what does this really mean?
For example if I have Missclasification rate 0.41 does this mean that my model missed correct answer in 41% of the validated cases?
How can I know for example what was an average error? For example, if I had only two cases in validation set (T=4, T=5) and my model scored them both on 3, than it would miss on average by (1+2)/2=1.5
Can I get something like that from results?
Do you now any good book or papers or some other sources about interpreting results, especially what they mean without using advanced math?
And how can I interpret charts?
Best regards
Fooky

Accepted Solutions

- Mark as New
- Bookmark
- Subscribe
- Mute
- RSS Feed
- Permalink
- Report Inappropriate Content
You are analyzing a target that has 5 levels which you are treating as an ordinal variable. Binary targets are far easier to classify (yes vs. no, response vs. non-response, etc...) because there are only two outcomes. When you have more than two outcomes, you have to consider how 'bad' it is to misclassify a level as a different level. For instance, if the observation has level 2, then how 'bad' is it to misclassify the observation as a 1? or 3? or 4? or 5? There is one to correctly classify each observation and 4 ways to incorrectly classify each observation, but what do you do when you have something like Prob(target=3) = 0.4 and Prob (target=3) = 0.3 and Prob(target=5)=0.3 and the Prob (target=4) = 0.1? You have to take into account the probabilities and the 'risk' in misclassifying an observation as something it is not. This is inherently very confusing even with only 3 possible levels let alone 5. It is often the case where not all levels have the same number of observations and the most common level already has an advantage in being picked over all of the others by default.
By default, SAS Enterprise Miner classifies observations into the level that is most likely based on the predicted probabilities for each level, and misclassification is determined whether that classification is right or wrong. The 41% misclassification rate you observed is not very informative overall because there are so many ways in which someone could be misclassified. Given that your target is ordinal, you have to determine whether misclassifying a 3 (for instance) as a 2 or 4 are equivalent or is it worse to guess too high a level rather than too low a level? If it is not balanced, what about a 1 vs 4 or 2 vs 5? Inevitably, models which try and model multiple levels of a categorical target require further resolution based on the final probabilities and 'risk' associated with misclassifying an event.
In practice, it is sometimes better to build more models which have binary response values. For example, perhaps you are really interested in comparing levels 1 and 2 to levels 3 through 5. You can always go back to fit additional models to try and separate each smaller group of levels. You will likely find interpretation easier in this light.
I hope this helps!
Doug

Don't miss out on SAS Innovate - Register now for the FREE Livestream!
Can't make it to Vegas? No problem! Watch our general sessions LIVE or on-demand starting April 17th. Hear from SAS execs, best-selling author Adam Grant, Hot Ones host Sean Evans, top tech journalist Kara Swisher, AI expert Cassie Kozyrkov, and the mind-blowing dance crew iLuminate! Plus, get access to over 20 breakout sessions.
Use this tutorial as a handy guide to weigh the pros and cons of these commonly used machine learning algorithms.

Find more tutorials on the SAS Users YouTube channel.
-
1 reply
-
11-13-2012 11:14 AM
-
3927 views
-
0 likes
-
2 in conversation
-
