- Home
- /
- Analytics
- /
- SAS Data Science
- /
- Re: How to do Link Network Node in EM?
- RSS Feed
- Mark Topic as New
- Mark Topic as Read
- Float this Topic for Current User
- Bookmark
- Subscribe
- Mute
- Printer Friendly Page

- Mark as New
- Bookmark
- Subscribe
- Mute
- RSS Feed
- Permalink
- Report Inappropriate Content
Hi everyone,
I am quite new to SAS. I would like to do a network analysis, and it seems that SAS EM can do it now. I read some post that they explain the concept and how to do it for example, by extracting data from Facebook or twitter like this http://blogs.sas.com/content/sascom/2014/02/19/exploring-social-networks-with-sas-visual-analytics/ and this How to Use the Link Analysis Node as a Clustering Tool in SAS® Enterprise Miner™
My issue is that I couldn't find it How exactly to do it in EM in steps !! I have raw data in a table (csv format) that rows contain samples (27) and columns contain data about those samples (70). Clustering would do what I need and I have done it, but I also visualize such connections by network analysis as it has cool representation.
So for the first step I assume I need to import the raw data in EM to do network analysis but counted figure it out. Sorry if it is a lame Q.
Thanks in advance

- Mark as New
- Bookmark
- Subscribe
- Mute
- RSS Feed
- Permalink
- Report Inappropriate Content
Hey Hank,
There are a lot of videos and papers that will help you catch the learning curve really fast.
Please describe your data and what you are trying to visualize and people will have more specific suggestions. Right now I am not completely sure if you want to use EM to visualize your clusters or if you want to do link analysis.
Below how you do link analysis for the first time and an alternative that I really like for visualizing networks.
If this is your very first EM project, spend some minutes watching Getting Started with SAS Enterprise Miner: Setting Up an Enterprise Miner Project.
You can skip the part where they create a Data Source because you can use the File Import node to import your csv. I personally prefer creating data sources the way they do it in the video, but the File Import will get you started faster.
Steps for Link Analysis
1. Add a File Import node to your diagram (find it on the "Sample" tab). Then click on the ellipsis for Import File to select your csv file. Right after that click the ellipsis for Variables to make sure all the roles are levels are set the way you need them.
2. Connect a Link Node to your File Import. If you were analyzing facebook posts the way Falko does in his post, I would use only two nominal inputs: ID of the conversation, and name of the participant. You can use the variables ellipsis to specify this.
Alternative: Visualize Networks with the Association node
I like the Association node to visualize networks because the results are more flexible and the rules are easy to interpret in terms of stats like support and frequency.
To do this you will need to set the role of your data set as transaction (instead of raw or train) when you import it or change it in your diagram directly if you have your data as a Data Source. Then run the Association node with an ID variable and an input for the name of the participant.
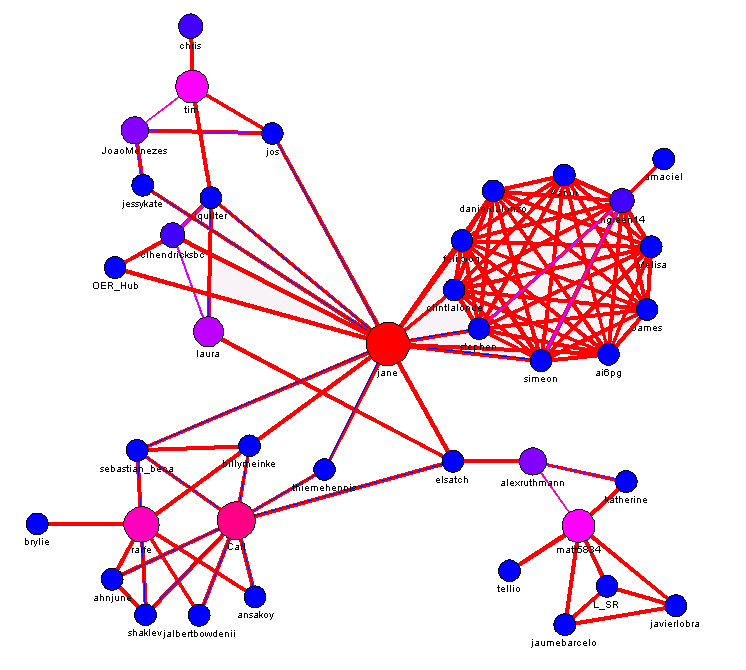
For example, here I analyzed an online community similar to SAS online communities. The name of the post was an ID variable and the name of the participant a nominal input. I had to manually re-arrange the network a little bit to clearly show that these network had 4 sub-networks, one of them really active and collaborative, as well as a very influential participant that connected all four.
I hope it helps,
Miguel
- Mark as New
- Bookmark
- Subscribe
- Mute
- RSS Feed
- Permalink
- Report Inappropriate Content
Hi Miguel,
Thanks for the reply. I will check the videos that you suggested and will follow your instructions. Regarding my data, there are 27 samples from three different categories( as rows) and up to 70 bands as columns ( that refer to taxonomical groups). I just want to get a nice representation. I already have cluster analysis results but would be good to have it in this way as well.
Thanks
Hank

Don't miss out on SAS Innovate - Register now for the FREE Livestream!
Can't make it to Vegas? No problem! Watch our general sessions LIVE or on-demand starting April 17th. Hear from SAS execs, best-selling author Adam Grant, Hot Ones host Sean Evans, top tech journalist Kara Swisher, AI expert Cassie Kozyrkov, and the mind-blowing dance crew iLuminate! Plus, get access to over 20 breakout sessions.
Use this tutorial as a handy guide to weigh the pros and cons of these commonly used machine learning algorithms.

Find more tutorials on the SAS Users YouTube channel.
-
2 replies
-
05-04-2015 12:33 PM
-
966 views
-
4 likes
-
2 in conversation
-
