- Home
- /
- Analytics
- /
- SAS Data Science
- /
- Re: Classification Matrix on Test Set
- RSS Feed
- Mark Topic as New
- Mark Topic as Read
- Float this Topic for Current User
- Bookmark
- Subscribe
- Mute
- Printer Friendly Page

- Mark as New
- Bookmark
- Subscribe
- Mute
- RSS Feed
- Permalink
- Report Inappropriate Content
Hello,
I am new in forum and in SAS.I am trying to find classification matrix on the Test Set, after using a Scorecard Node, but I am only able to see it for the training set.
I am uploading my diagram.
Any help would be much appreciated


- Mark as New
- Bookmark
- Subscribe
- Mute
- RSS Feed
- Permalink
- Report Inappropriate Content
Hi Geo,
Thanks for the clear screenshot. It sure helps.
Not sure why you are not seeing the Classification Table for your Test Set. I assume you are seeing it for your Train and Validation, but not for your Test set?
Investigating on that...
In the meantime, I noticed that you kind of combined two popular approaches for this problem. A quick scoop of the 2 approaches and why I think you might not want to combine them.
Take a look at the attached image. 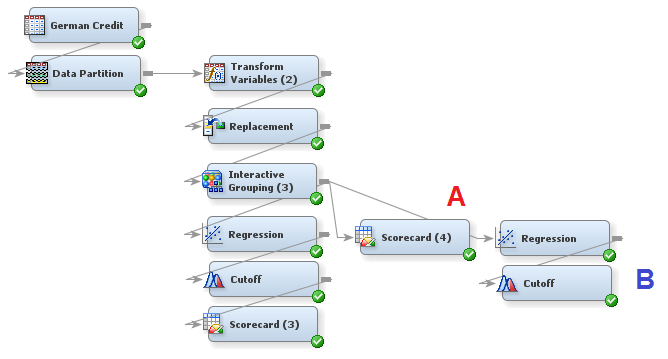
Flow A (Data->Partition->IGN->SC) is the most common way to model a binary target for a regulated environment like credit scoring.
- IGN node bins your data into useful groupings, and lets you override the weight of evidence so that you can correct bias or better prepare your model for future data. It also preselects the most useful variables for the scorecard node, and rejects all other variables.
- Scorecard node will run a logistic regression and transform the parameter estimates into a scorecard, which means that score points for each attribute can be interpreted as a "double the odds of an event happening" for each X number of points (20 points by default).
Flow B (Data->Partition->IGN->Regression->Cutoff is a common way to customize a regression when you do not care much about having score points to interpret.
- IGN just like described above, this node comes up with the useful groups, and by default it only passes the most useful variables to the regression node.
- Regression node can be customized to use a linear or a logistic regression.
- Cutoff node enables you to override the 0.5 cutoff for a predicted probability to be considered an event. This helps you customize the assessment of your models.
When you combine both approaches they way you showed in your screenshot, I am pretty sure that your Regression and Cutoff get ignored, although I haven't checked this thoroughly. The reason is that the Scorecard node will do its own regression anyway and there is no way to turn it off, and it cannot just pick up any findings from another regression node. A way to see this is that the Scorecard node is a model node on its own.
I hope this helps with your task. I will keep you posted with what I find about the test classification matrix.
Thanks!
Miguel
- Mark as New
- Bookmark
- Subscribe
- Mute
- RSS Feed
- Permalink
- Report Inappropriate Content
Hello Miguel,
Thank you for your concern, I understood know why I shouldn't have both regression and scorecard. In Data partition I have 66% train and 34% test. What I am trying to find is first the parameter estimates for the predictive variables using logistic regression after using coarse classification, which confuses me a bit because I have group variables and WoE variables. And then I am trying to find the classification matrix and ROC diagram for both train and test sets with a 0.5 cut-off. I used Scorecard because it was the only node that had a result for the ROC curve.Any idea of how I can do it?
I hope what I am trying to find is possible.
Thanks again!
- Mark as New
- Bookmark
- Subscribe
- Mute
- RSS Feed
- Permalink
- Report Inappropriate Content
I think what you want is to:
-have 66% train and 34% validation in the data partition node.
-if you want to use the 0.5 cutoff, you don't need the Cutoff node. If you want any other value than 0.5, then you do need the cutoff node to specify that value.
-add a Model Comparison node after any model node (like regression node) to see a ROC curve. Even if you only have one model to compare, this node will give you all the stats you want, including a ROC plot. Notice that the area under the ROC curve is called c-statistic in the Model Comparison node results.
I hope it helps,
Thanks,
Miguel
- Mark as New
- Bookmark
- Subscribe
- Mute
- RSS Feed
- Permalink
- Report Inappropriate Content
Thanks I am understanding more and more ![]() . So validation set or test is the same?
. So validation set or test is the same?
I found ROC plot and I can see classification table for both train and validation sets.
I am also trying to find the accuracy ratio, is it the same with Gini coefficient?(Found it)
I can't find AUC or C-statistic, I am uploading a screenshot from my results.
Thank you so much!

- Mark as New
- Bookmark
- Subscribe
- Mute
- RSS Feed
- Permalink
- Report Inappropriate Content
I found AUC it is called ROC index.
My only issue now is regarding test set or validation set usage. From what I read is not the same. There should be a way to see the results for the test set.

Don't miss out on SAS Innovate - Register now for the FREE Livestream!
Can't make it to Vegas? No problem! Watch our general sessions LIVE or on-demand starting April 17th. Hear from SAS execs, best-selling author Adam Grant, Hot Ones host Sean Evans, top tech journalist Kara Swisher, AI expert Cassie Kozyrkov, and the mind-blowing dance crew iLuminate! Plus, get access to over 20 breakout sessions.
Use this tutorial as a handy guide to weigh the pros and cons of these commonly used machine learning algorithms.

Find more tutorials on the SAS Users YouTube channel.
-
5 replies
-
05-05-2014 06:51 PM
-
1894 views
-
6 likes
-
2 in conversation
-
