What is SAS Visual Scenario Designer?
SAS Visual Scenario Designer is the first data-driven solution for interactive rule and scenario authoring, testing, and validation. Supporting both batch and real-time streaming deployment options, it is integrated with the SAS Visual Analytics suite. This integration enables you to explore, test, and develop analytic models and scenarios as part of the scenario and rule authoring process.
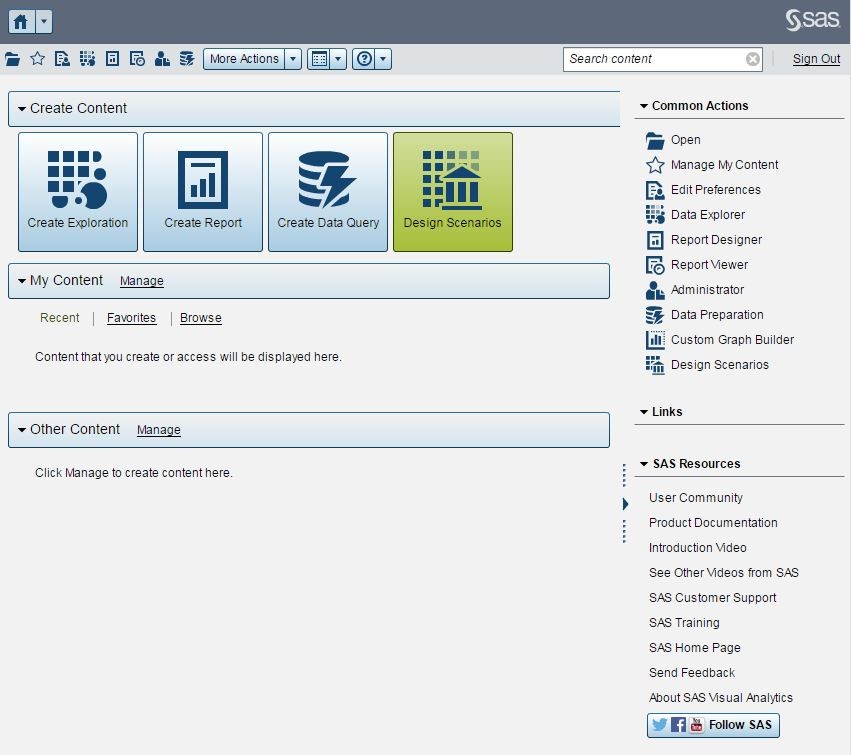
With a license, you can access SAS Visual Scenario Designer from the SAS Visual Analytics Hub.
|
Accessing SAS Visual Scenario Designer from the SAS Visual Analytics Hub
|
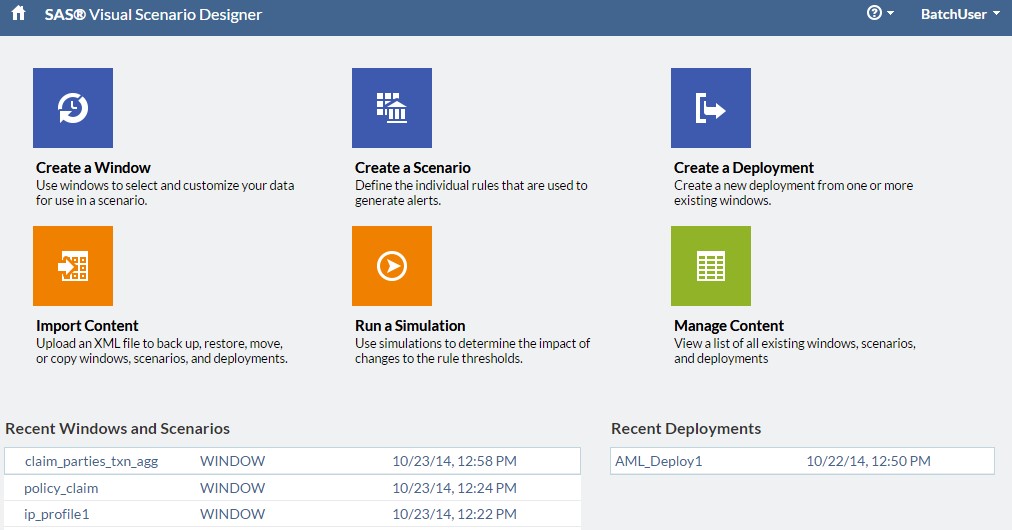
SAS Visual Scenario Designer: Main Screen
Several other features make SAS Visual Scenario Designer unique:
- Full back testing, governance, and “what if” scenario analysis capabilities
- Easy-to-use advanced analytics enable you to uncover previously unknown patterns in your data
- Integration with SAS Event Stream Processing Engine for deploying real-time low latency scenarios
- Integration with SAS Laser Analytic Server for performing batch and interactive decision making
How will SAS Visual Scenario Designer help me?
The responsive design of SAS Visual Scenario Designer enables you to prepare, transform, explore and uncover patterns of interest in your data. Unlike traditional rule-based systems, which are not data-driven, SAS Visual Scenario Designer enables you to shape your rules with data – lots of data. The integration with SAS Visual Analytics means that you can explore data as you develop scenarios and rules, which gives you a clear understanding of the interrelationships within your data. Integration with statistical components like SAS Visual Statistics enables you to develop exploratory models using logistic regression, decision trees, and clustering algorithms as part of your decision making or scenario process. SAS Visual Scenario Designer also provides simulation capabilities so that you can back-test scenarios and rules over time, as well as perform “what-if” analyses to see the impact of rule changes before deployment.
How does SAS Visual Scenario Designer work?
SAS Visual Scenario Designer consists of four main components: windows, scenarios, deployments, and simulations.
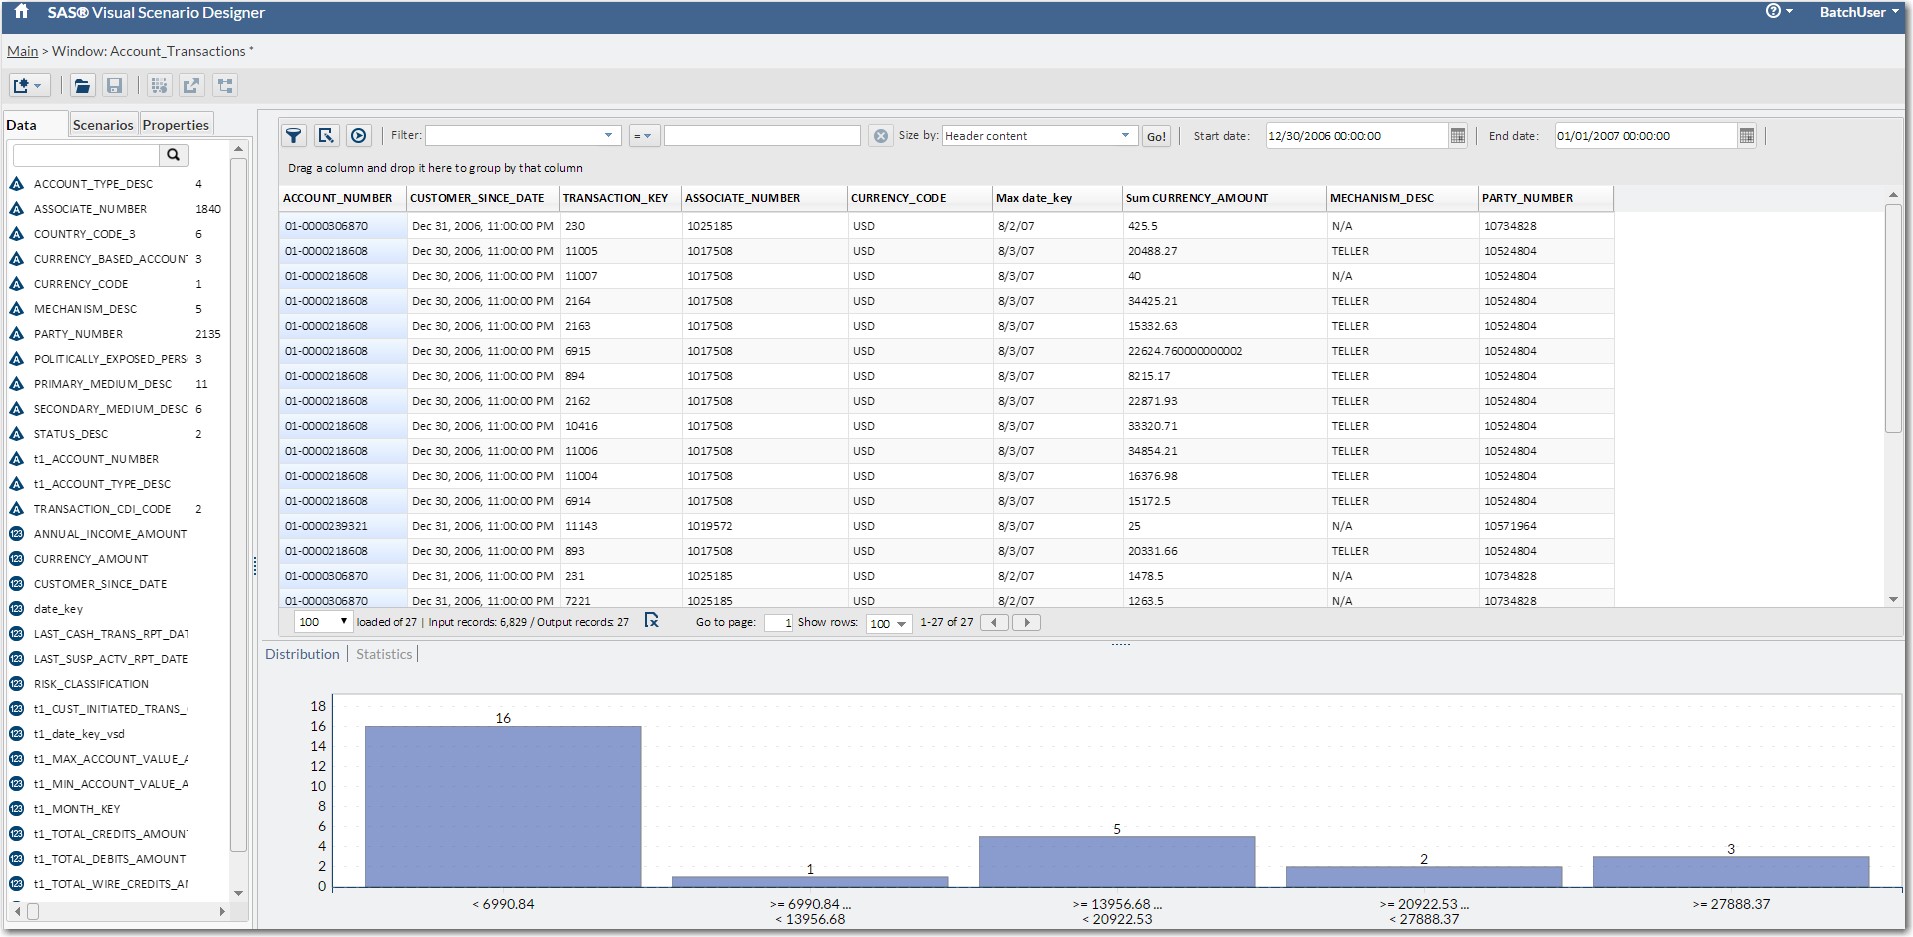
1. A window is how SAS Visual Scenario Designer takes raw-input data and aggregates or prepares it for analysis. Most data of interest comes in the form of transactions or events, and generally has a time element to it. A window is simply a summary of this input data. Windows enable you to author variables using time- and order-based conditional control. Aggregation and date-based lookbacks are two common examples.
|
SAS Visual Scenario Designer: Window Screen
|
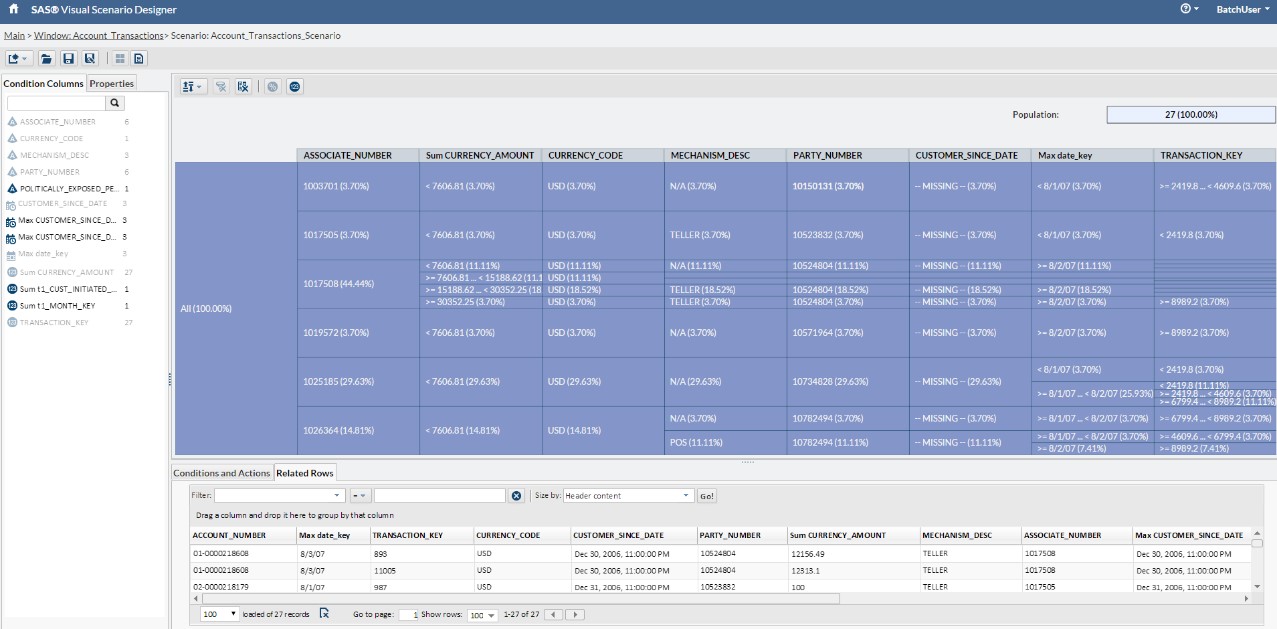
2. A scenario is the combination of business rules applied to a window. SAS Visual Scenario Designer provides a number of rule or scenario authoring tools to aid in the decision making and rule authoring process. These include decision tables, decision trees, and a cross-tab rule explorer. Rule actions enable you to apply business decisions to data. For example, in the case of fraud, an action might be to generate an alert, while in the case of a loan decision it might be to approve or decline a loan application.
|
SAS Visual Scenario Designer: Scenario Screen
|
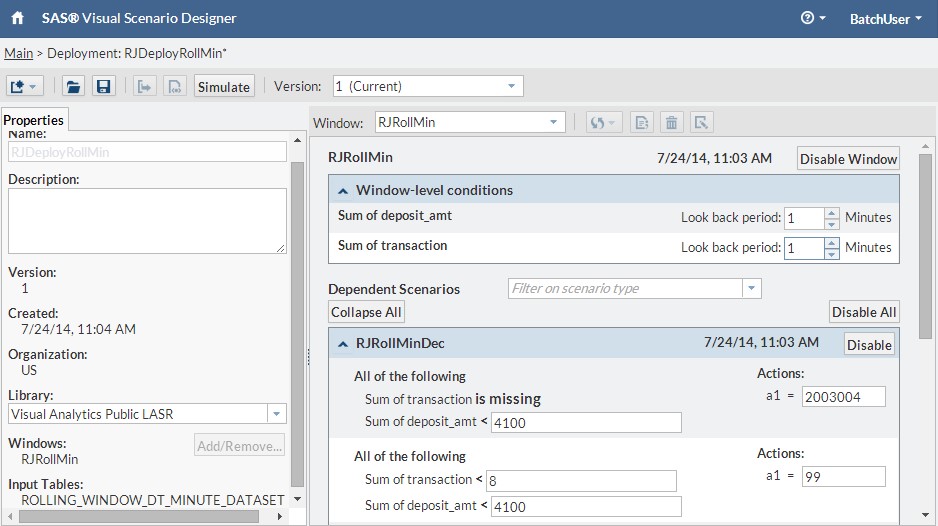
3. A deployment enables you to deploy scenarios for operational consumption. SAS Visual Scenario Designer currently supports two execution engines: the SAS LASR Analytic Server and the SAS Event Stream Processing Engine. You can apply parameter values that you can customize for your organization.
|
SAS Visual Scenario Designer: Deployment Screen
|
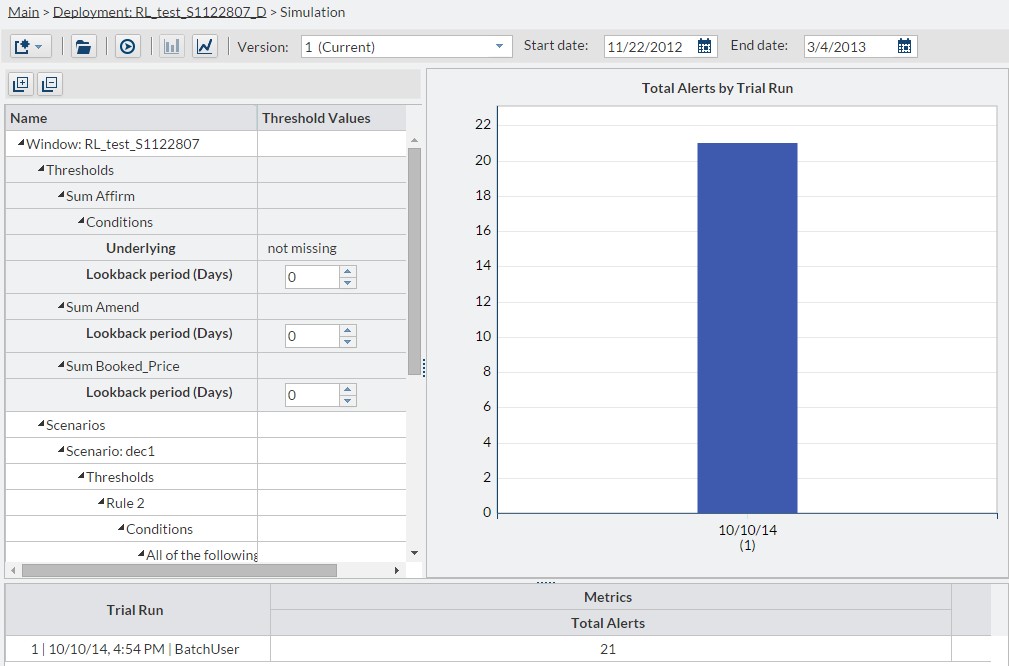
4. A simulation enables you to test and apply “what-if” analyses to simulating different business conditions or assessing the impact of decision changes. You can test impacts such as rule thresholds or compare the results of an execution over time.
|
SAS Visual Scenario Designer: Simulation Screen
|
Here are some tasks that you can perform when working with the four main components:
- Create a window where you select, prepare, and explore data for use in a scenario.
- Author scenarios based on business rules, data exploration, and statistical models.
- Deploy your scenarios to produce alerts or detect patterns or events of interest. You can customize the activation to fit any subset of your entire organization and specific time periods.
- Simulate the impact of scenarios on operations by comparing different time periods, different data, or changes in rules over time.
What next?
You can use the events or patterns of interest that you identify in SAS Visual Scenario Designer in other applications (such as SAS Visual Analytics or SAS Visual Statistics) to generate potential alerts.

