SAS Visual Analytics is a tool that's ideally meant to surface all available report objects in a given report for view at once. While this is a best practice, inevitably you will encounter situations where you need to display more information on a screen.
To accommodate such instances, SAS Visual Analytics 6.4 provides three different types of container objects that allow you to stretch the available real estate on a given tab or section beyond what's immediately viewable. Each container comes with its own set of quirks, and it's probably a good idea to try them all to figure out what works best for your set of reporting requirements. Here's a quick rundown on the three containers and what they can and cannot do.
Stack Container
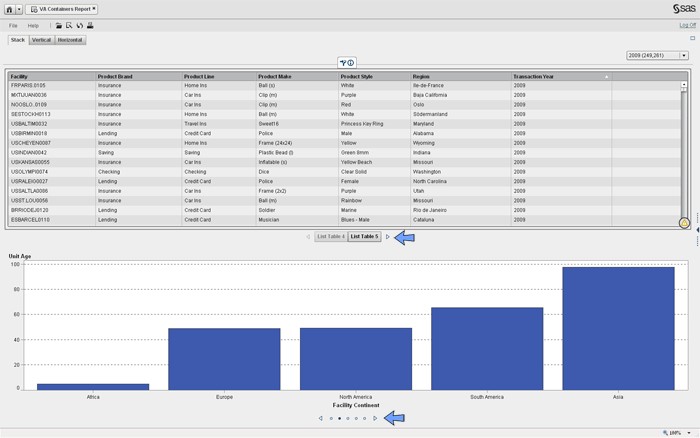
Introduced in SAS Visual Analytics 6.3, the stack container works in a fashion similar to Apple's old iTunes "Coverflow" design. The stack container displays the entire report object (table, graph, pie chart, etc.) at once and allows you to page between objects by pressing either a button, text links, or dots (see blue arrows in illustrations). All report objects can be displayed on the top or the bottom of the container but not the sides. You can place multiple stack containers in a single report section, and interactions among objects in the container work just as they would without being included in the container. I've found the stack container works best when it's in a section where all the other report objects are also in stack containers.
I personally prefer this container to the other options, simply because it's the best use of real estate and allows you to see the entire report object at one time. You don't have to worry about sizing the individual objects.
On the other hand, if those viewing the report aren't familiar with how the object works, paging through the stack container may not be very intuitive. One word of caution: the stack container itself must be clicked on first, then you can "fullscreen" zoom it to see any objects inside it. You cannot simply click on the objects themselves. This behavior is a little confusing and is something you may need to help consumers of SAS Visual Analytics reports adjust to.
Vertical Container
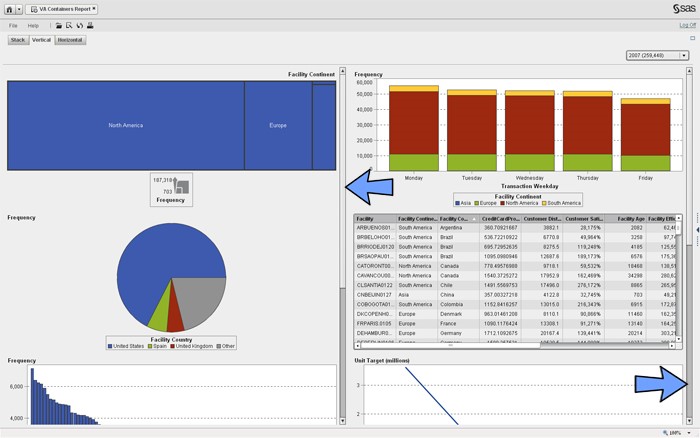
Introduced in SAS Visual Analytics 6.1, the vertical container has been around for quite some time now, and it's best suited for displaying collections of similar content (e.g., multiple pie charts) in a single column. Unlike the stack container, you navigate among the objects in the vertical container using the vertical scrollbar in which the objects are placed (see blue arrow in illustration). This container is best for report consumers who want to use a more universal navigation style. You can place multiple vertical containers in a single report section, and interactions among objects in the container work just as they would without it.
While the stack container's biggest asset it is ability to display the entire report object at one time, the vertical container's main drawing point (the scrollbar) makes it necessary for users to size the report objects to maintain the preferred height. If you try to drag the report object's borders to resize it, you'll likely encounter some odd behavior, as objects will sometimes resize, and other times collapse or disappear altogether. To avoid the confusion, just set the height for the report object in its properties pane.
Horizontal Container
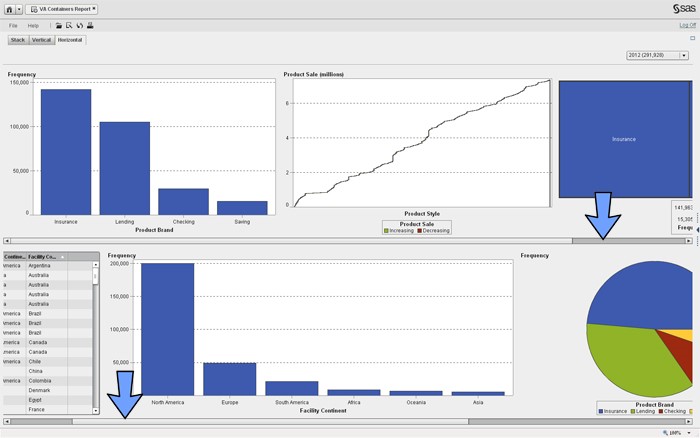
Also introduced in SAS Visual Analytics 6.1, the horizontal container behaves just like its vertical counterpart, albeit with the obvious difference in orientation. Much like the stack container, the horizontal container's objects are placed side by side (rather than bottom to top), which makes it a viable alternative for report consumers who prefer this flow. All of the caveats of the vertical container apply to the horizontal container as well. Resizing the width of report objects in the container is best done in the properties pane, unless you're a glutton for punishment.
Conclusion
I prefer the stack container. I think it makes the best use of the available real estate, gives a more polished overall look, and eliminates the need to set the width or height of the objects displayed inside it.


