Introduction
Are you looking for a way to incorporate your R code into SAS® Enterprise Miner™ (EM)? The Open Source Integration node is what you need. This node not only offers a bridge between EM and R, but also empowers EM users to access to a wider range of statistical learning methods.
In the example below, I will demonstrate how to use the Open Source Integration node to run a spectral clustering method within EM.
Load Data
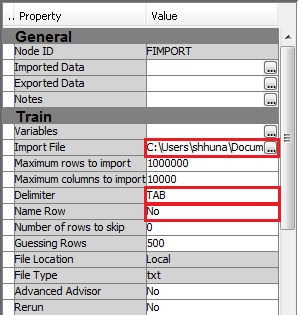
The data in this example can be downloaded from a public website. It is available in the tab-delimited format without a name (header) row. The steps of importing the example data are as follows.
- Download the data set from http://cs.joensuu.fi/sipu/datasets/jain.txt to your local machine.
- Drag a File Import node from the Sample tab to your diagram workspace.
- Enter TAB into the Delimiter property.
- Set the Name Row property to No.
- Click the ... to the right of the Import File property.
- Select the My Computer option.
- Click the Browse button to locate your downloaded file, and then click the OK button.
Use the File Import node to load data sets that are stored in common delimited text formats, such as csv, tsv, etc. If your data is in SAS data set format, you should import it as a standard EM data source.
Set Up Open Source Integration Node
- Drag an Open Source Integration node from the Utility tab to your diagram workspace.
- Connect the File Import node to the Open Source Integration node.
- Set the value of the Training Mode property to Unsupervised and the value of the Output Mode property to None. Note that the other output modes (PMML and Merge) can allow variables created in R to be used in subsequent nodes in a workflow. You can find the detailed usage of these modes in SAS Enterprise Miner 13.2 Reference Help.
- Click the ... to the right of the Code Editor property to open the Code Editor window.
- Enter the following code into the Code Editor.
library('kernlab')
sc <- specc(as.matrix(&EMR_IMPORT_DATA[1:2]), centers=2)
png("EMR_SPECC.png")
plot(&EMR_IMPORT_DATA[1:2], col=sc)
dev.off()
- To compare the result between spectral clustering and K-means, you can follow the previous steps to create another Open Source Integration node. Enter the following code into the the Code Editor.
m <- kmeans(&EMR_IMPORT_DATA[1:2], 2)
png("EMR_KMEANS.png")
plot(&EMR_IMPORT_DATA[1:2], col=m$cluster)
dev.off()
In the first Open Source Integration node, we load the kernlab library in R and run the spectral clustering function specc on the first and second columns of the data (i.e. &EMR_IMPORT_DATA[1:2]). Note that these columns should be numeric columns. We specify the number of clusters to be two and plot the result in a scatter plot where data points are colored based on their cluster membership. We save the output figure to ''EMR_SPECC.png''.
In the second Open Source Integration node, we call the kmeans function. To see the difference between spectral clustering and K-means, we also set the number of result clusters to be two. The file name of the output figure is ''EMR_KMEANS.png''.
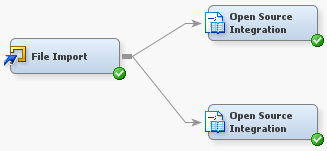
Below is the complete diagram.
Run and Get Results
- Right-click each of the Open Source Integration nodes and select Run. In the Confirmation window, click Yes. After the node has successfully run, click Results in the Run Status window.
- To view the output figure, click View → SAS Results → Train Graphs.
Below are the two output figures.
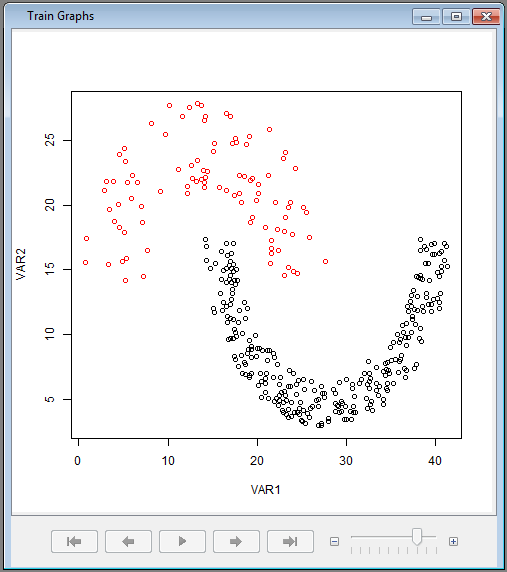

As shown in the figures, spectral clustering (on the left) performs better on this data set than K-Means (on the right) in terms of accuracy.
Summary
To sum up, the Open Source Integration node enables users to integrate R code into Enterprise Miner workflows. For more details about the node, please refer to the help document in SAS® Enterprise Miner™.
Reference

