- Home
- /
- SAS Communities Library
- /
- Tip: How to model a rare target using an oversample approach in SAS® ...
- RSS Feed
- Mark as New
- Mark as Read
- Bookmark
- Subscribe
- Printer Friendly Page
- Report Inappropriate Content
Tip: How to model a rare target using an oversample approach in SAS® Enterprise Miner™
- Article History
- RSS Feed
- Mark as New
- Mark as Read
- Bookmark
- Subscribe
- Printer Friendly Page
- Report Inappropriate Content
Even today in the Big Data era, it is still a frequent challenge for data miners to train a predictive model for data sets with a rare or relatively low count of events on your target variable.
There are a few ways to do it and the reply to this post gave a fantastic answer on how to model a rare target event using oversample in Enterprise Miner. I summarized this approach in this example for you to both simulate a data set with a rare target event and try out the oversample or balanced sampling approach. If balanced sampling is impractical in your case, SAS® Enterprise Miner™ Reference Help describes other five methods to deal with rare target events in the section Detecting Rare Classes.
Simulate a data set with a rare target event
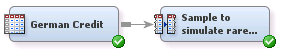
If you don’t have handy a data set with a rare target event, you can use this first part of the diagram to transform the German Credit data set into a rare target mockup version.
On your Sample node specify:
| Property | Value | In plain English |
|---|---|---|
| Criterion | Level Based | You want a stratified sample based on one of the levels of your target. |
| Level Selection | Rarest Level | You want to specify sample and level proportion for the rarest level on your target variable. For this example it is a great shortcut to specify rarest level since you know that you have less bads (events) than goods in your data. Otherwise you need to make sure that bad is the specified event for your data set. |
| Level Proportion | 10 | To mock up a rare target, you only want to keep 10% of the bads, which are the rarest level you specified in the level selection. |
| Sample Proportion | 5 | Coming out of your Sample node you want the proportion of bads to goods so that you have 5 bads for each 95 goods. Feel free to experiment with lower sample proportions. |
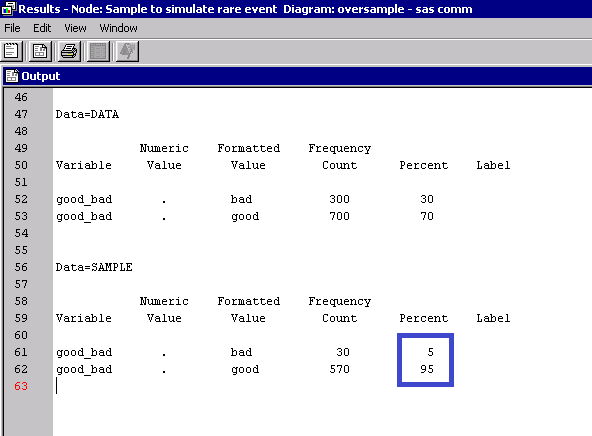
Run this first part of the flow and notice from the Sample node results that the original data had 300 events and a proportion of 30 bads for each 70 goods. After your sample node now you have 10% of the original bads (30), and a proportion of 5 bads for each 95 goods.
Oversample and train a model
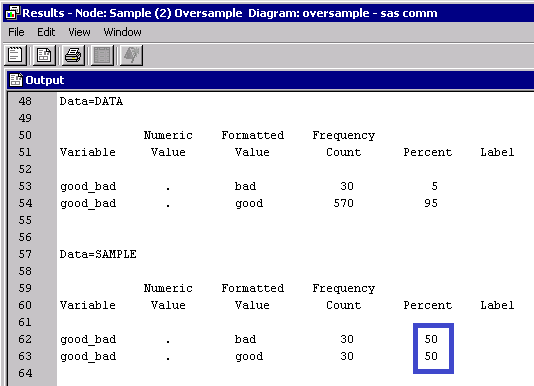
Now that you have a data set with a rare target event, let's oversample. To do that use another Sample node and specify Type as Percentage, Percentage as 100.0, and Criterion as Equal. This will give you a data set that has all your events and a random sample of your non-events. For this example you kept the 30 bads (events) and only a random sample of 30 out of the 570 goods (non-events) in the input data set.
Next step you need to add a Data Partition node with 70% for training and 30% for validation. Then add a Decisions node to specify the correct decision consequences. In your Decisions node, specify Apply Decisions as Yes, Decisions as Custom, then open the Custom Editor. On the Decision Weights tab, you will want to enter the inverse priors based on the "original" proportion of rare events, 0.05. So your decision matrix should look like this:

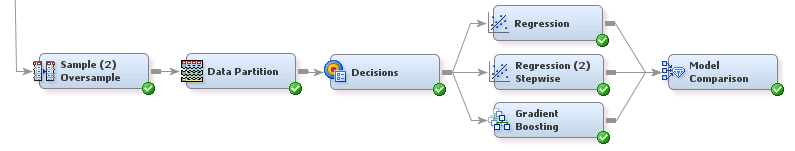
Add some models and a Model Comparison node to select the best one. For this example I used a logistic regression, a logistic regression with stepwise selection, and a gradient boosting. Your diagram should look like below. Feel free to add more model nodes.
When you specify Apply Decisions=Yes using a Decisions node or directly on your data source node, the Model Comparison node selects the best model according to average profit. This is the statistic you want to use for oversampled data sets because none of your other fit statistics like misclassification or mean square error are adjusted in this case (NOTE: you could have alternatively entered the true prior probabilities in the Decision node to have the posterior probabilities adjusted accordingly, then these statistics would be valid).
Note from the results that for this example the Model Comparison selected the gradient boosting model because it has slightly better average profit.
Average profit is calculated depending on your target and your model. For a binary target and a decision tree model it is calculated as:
Expected profit=Posterior_probability_non_event *corresponding_value_on_profit_matrix +posterior_probability_of_event *corresponding_value_on_profit_matrix
Find more details in the Reference Help under the Decisions section of the Predictive Modeling chapter.
Since there is more than one way in Enterprise Miner to do this, I am curious here to know how you approach modeling data sets with rare target events. How would you model this?
I hope you find this useful. All comments welcome!
Good luck!
-Miguel
- Mark as Read
- Mark as New
- Bookmark
- Permalink
- Report Inappropriate Content
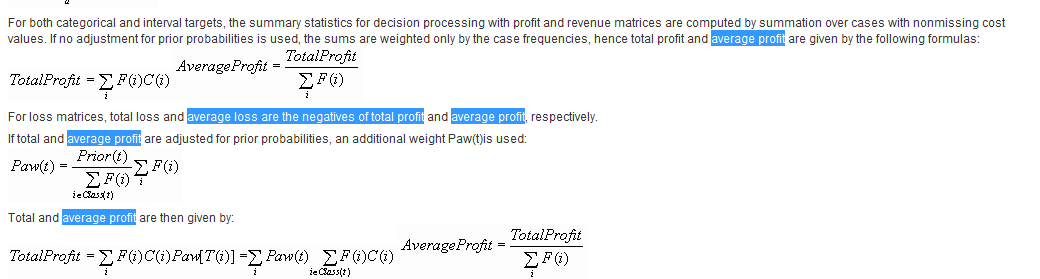 In SAS EM, the expected profit is used to compute the decision threshold where as the average computed profit is used as an assessment statistics in model comparison and selection. The formula for computing average profit is different from computing the expected profit. Please see the details of average profit computation from SAS EM help:
- Mark as Read
- Mark as New
- Bookmark
- Permalink
- Report Inappropriate Content
Hi,
I have rare Linear targets in my data.( 3000000 obeservations ,1800 obesrvations are in linear and remaining obesrvations are zeros)
How can I oversample the data for interval target ( I am using Linear Regression) or please can you suggest me the procedure to build a model.
thanks,
sathya.
- Mark as Read
- Mark as New
- Bookmark
- Permalink
- Report Inappropriate Content
Hi, the diagram attached differs from the instructions listed above. The Decision node in the diagram under Train shows the following. Decisions set to Property (Custom in the example above) and Matrix is set to inverse priors. Following along, I switched this to custom and checked the decision matrix. This is set to "Do you want to use decisions?" Yes and has decision weights 1.428/0, 0/3.33. These would correspond to the weights of the original data set and not the first sample.
- Mark as Read
- Mark as New
- Bookmark
- Permalink
- Report Inappropriate Content
In response to sathya66's question above from a while ago, in case it helps someone else:
Q: I have rare Linear targets in my data.( 3000000 observations ,1800 observations are in linear and remaining observations are zeros)
How can I oversample the data for interval target ( I am using Linear Regression) or please can you suggest me the procedure to build a model.
A: To model data like this, if you create another variable that is an indicator of whether your interval target is > 0 or =0, then set that as a binary target in addition to your interval target, you can use the TwoStage node with the Filter property set to Non-Events.
- Mark as Read
- Mark as New
- Bookmark
- Permalink
- Report Inappropriate Content
Why was this example oversampled to 50%? Some do not recommend making the sample balanced. Is there a reference of what to oversample to?
- Mark as Read
- Mark as New
- Bookmark
- Permalink
- Report Inappropriate Content
In SAS Enterprise miner Gradient boosting, for a binary target using square loss function and best assesment value = average square error, I get , the scoring code these two variables are initialized _ARB_F = 1.09944342 and _ARBBAD_F = 0
For a interval target I found _ARB_F is initialized mean of my target variable but in the case of binary target how is _ARB_F initialised please help?
- Mark as Read
- Mark as New
- Bookmark
- Permalink
- Report Inappropriate Content
Hi,
Thanks for this. What if there are more than two levels in the target variable and a multinomial regression model is applied?
- Mark as Read
- Mark as New
- Bookmark
- Permalink
- Report Inappropriate Content
Hi, I am wondering what the best selection statistic metric to use is for model comparison when comparing models for this type of data?
I have a log. reg. model, reg. model, grad. boost model, and ensemble model.
Also trying to make a forest model but it is not working.

Don't miss out on SAS Innovate - Register now for the FREE Livestream!
Can't make it to Vegas? No problem! Watch our general sessions LIVE or on-demand starting April 17th. Hear from SAS execs, best-selling author Adam Grant, Hot Ones host Sean Evans, top tech journalist Kara Swisher, AI expert Cassie Kozyrkov, and the mind-blowing dance crew iLuminate! Plus, get access to over 20 breakout sessions.
Free course: Data Literacy Essentials
Data Literacy is for all, even absolute beginners. Jump on board with this free e-learning and boost your career prospects.
Get Started
- Find more articles tagged with:
- data_mining
- enterprise_miner
- oversample
- rare_event
- rare_target
- tips&tricks
