One of the most powerful but most misunderstood (and occasionally frustrating) features of coding in SAS is the ODS system. ODS, which stands for Output Delivery System, is the way that the SAS system allows users to render output in the form of graphs and tables. It is very powerful but often confusing, especially to those coming to SAS from other statistical computing languages. Here are two tips that I have learned in the past few years that might help you leverage the power of ODS. It has to do with which output is rendered. I found myself asking the question….
WHAT IF I DON’T WANT TO SEE SO MUCH OUTPUT! JUST GIVE ME THE TABLES I WANT?!
This is a natural question for those coming from other programming languages. Whether it is R, Stata or Matlab, the amount of information SAS provides to the user after a statistical model is impressive. Sometimes, it is also cumbersome. So how can you limit output?
First, let’s make sure you have the ODS system on which you can ensure by entering,
ods graphics on;
at the beginning of your sas program.
From here let’s try to run a simple regression using the familiar REG procedure. Here is the output.
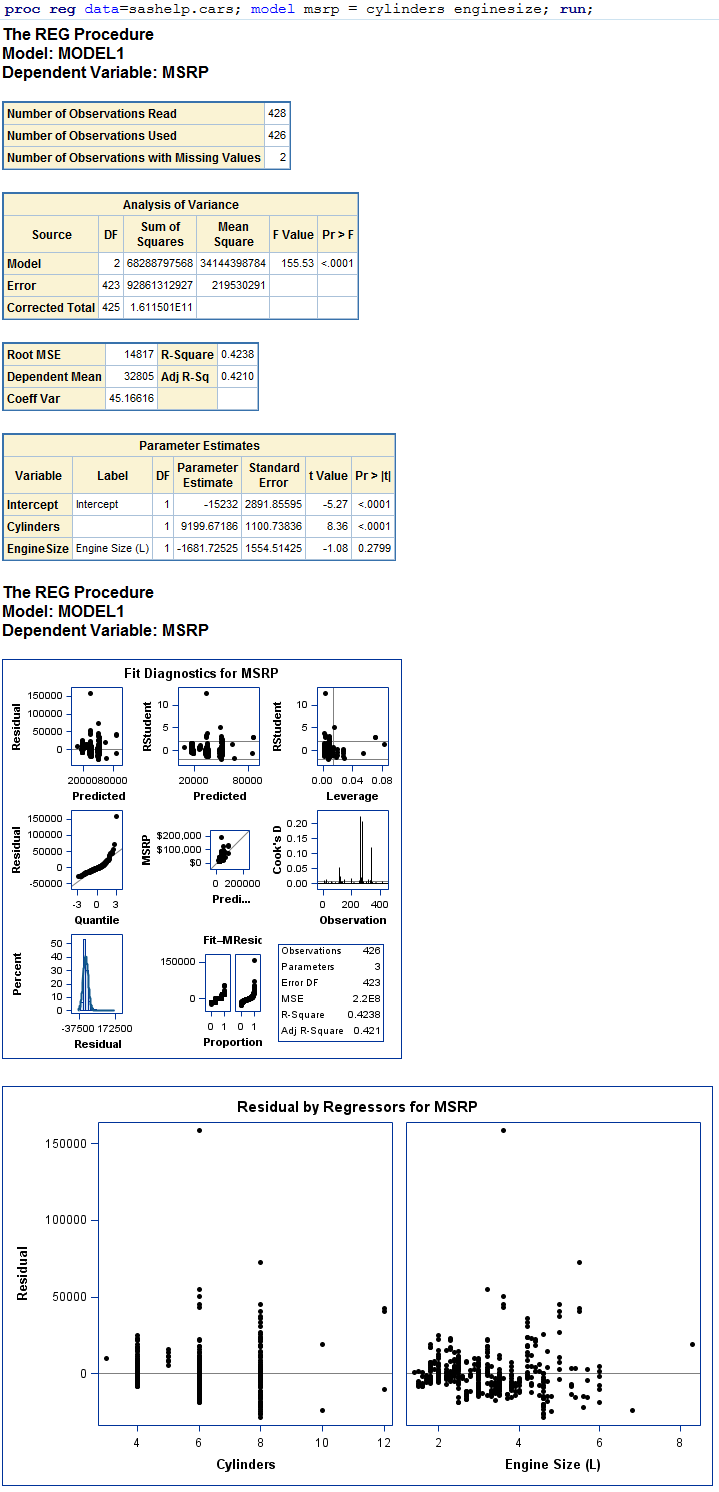
Gosh that is a lot of information!
What if I really just want to look at the fit statistics or perhaps just the coefficient table? How do I do this?
The easy way is with creative use of the “ods select” statements within the PROC call. Here is an example of how to just ask for the coefficient table.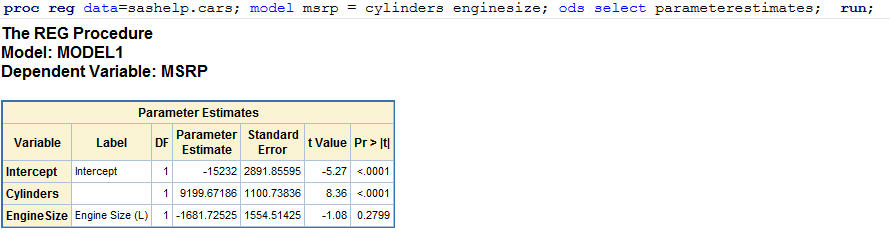
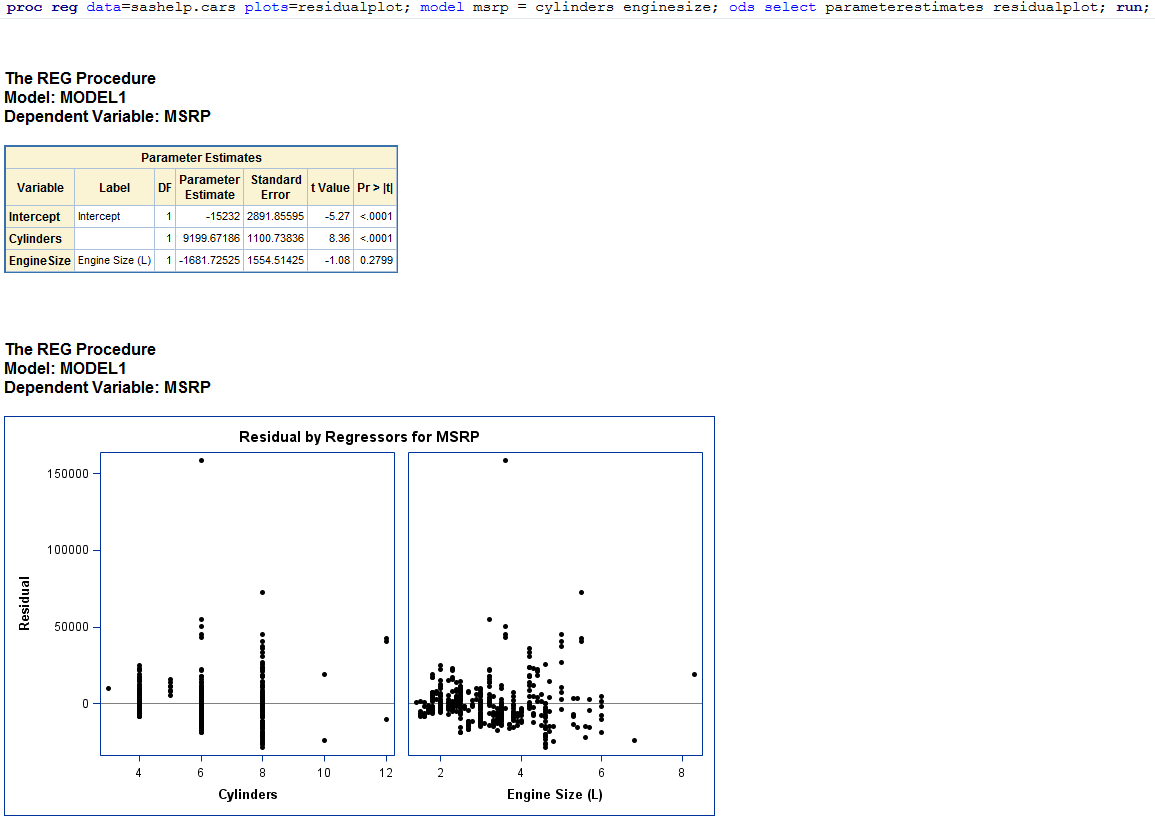
Or perhaps I just want to see the parameter estimates and the residual plots. Notice I need to make two changes to the syntax. First I must ask for the plot to be produced (plots=residualplot) as well as I need to add that item to the ods select statement. Here is the result.
So where can I find the name of these tables and graphics? Each table and graph in each PROC has a name. For a list of all the names you can go to the “Details” section for the documentation for each procedure. There are separate sections for “ODS Table Names” and “ODS Graphics”. Here are the sections for the AUTOREG procedure (Tables, Graphics).
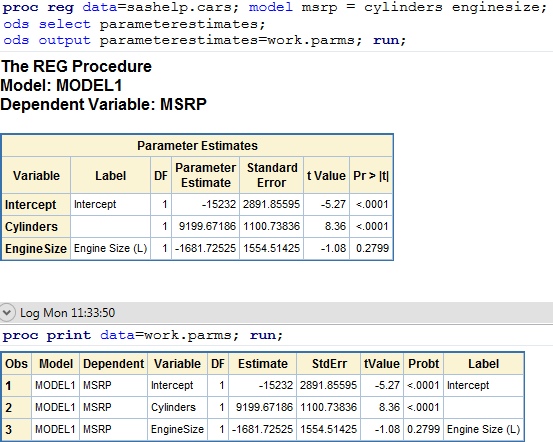
WHAT IF I WANT TO CREATE A DATASET FROM THE ODS TABLES I SELECT?
What if you want to save a specific ODS table to a data set? The “ODS OUTPUT” option allows for this. For example, if we want to save the above parameter estimates table as a sas dataset, you can add the “ODS OUTPUT PARAMETERESTIMATES=WORK.PARMS;” option to the PROC REG call. In this case, the file is saved in the WORK directory, but you can save it wherever you like.
These were just my suggestions. Do you have some of your own? Do you like using the ODS TRACE options?
Please share those in the comment section below so we all can become comfortable working with the powerful ODS options available to you.

