- Home
- /
- SAS Communities Library
- /
- How to update custom graphs in Visual Analytics 8.2
- RSS Feed
- Mark as New
- Mark as Read
- Bookmark
- Subscribe
- Printer Friendly Page
- Report Inappropriate Content
How to update custom graphs in Visual Analytics 8.2
- Article History
- RSS Feed
- Mark as New
- Mark as Read
- Bookmark
- Subscribe
- Printer Friendly Page
- Report Inappropriate Content
One of the most exciting features in SAS Visual Analytics (VA) 8.2 is the ability to import custom graphs built in SAS VA 7.4. With VA 8.2, not only can you import your VA 7.4 reports that contain custom graphs, but you can also change the properties of them. Updating the graph's data source, adding new titles and applying ranks are just some of the customizations that can be made to an imported custom graph.
In this post, I will demonstrate this by taking the custom graph I created in my post, How to place 4 measures on the same SAS Visual Analytics graph and within SAS Visual Analytics 8.2, make the changes described above. We will do this in three main steps: Importing the Custom Graph, Updating the Data Source, Updating The Graph’s Properties.
Step 1: Import The Custom Graph
First I will need to import the spk file attached to the article How to place 4 measures on the same SAS Visual Analytics graph into SAS VA 8.2. In order to do this, simply follow the steps outlined in Renato's post HERE. (You will also have to ensure that the original data source that the custom graph uses, CANCER.CSV, is loaded into CAS.)
Step 2: Update The Custom Graph’s Data Source
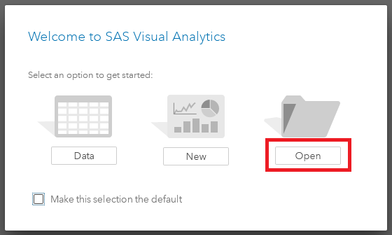
Once the spk package that contains the custom graph has been imported into SAS VA 8.2, open it by clicking the "Open" button that is displayed when you log into SAS Visual Analytics:
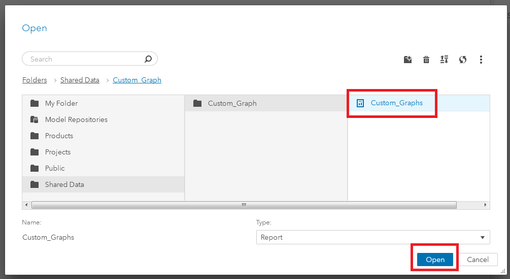
When importing a report from a previous version of SAS Visual Analytics, note that the report is made available in the same "Folder Path" that it was originally in VA 7.4. So in order to locate the imported "Custom Graph" report, navigate to "Folders > Shared Data > Custom_Graph" and select the report "Custom_Graphs" and click "Open."
Once the report opens, we can see the custom graph as it originally was displayed in the VA 8.2 Report Builder. However in VA 8.2, we can edit the graph using the menus on the right and left sides of the object canvas.
So, since we can change the properties of our custom graph the first thing I want to do is use a new CAS data set as its source. I would like to use the CAS data set, CARS (originally from the sashelp library), in this graphic. In the screenshot below, I've added the data set CARS to the report. For the variables in the graph itself, I will be using two different aggregations of the data items: MPG (City) and MPG (Highway). The two aggregations will be Mean (or AVG) and Median.
- MEAN MPG (City)
- MEAN MPG (Highway)
- Median MPG (City)
- Median MPG (Highway)
This will create the four measures to be used in the graph:
Now to add our new data to our custom graph. First we right click on the graph itself and choose "Remove all role assignments."
Now that all the graph's original role assignments have been cleared, we can go back to the data pane and ensure that the "CARS" data set is selected. Then we can drag and drop the "Make" variable onto the custom graph's Category role:
We can also add the customized MPG variables to the four measure slots in the order shown in the image below:
Step 3: Update The Custom Graph’s Properties
Now the imported custom graph is operating with a new data source! However we still need to make some modifications. For starters, the graph's title needs to be updated.
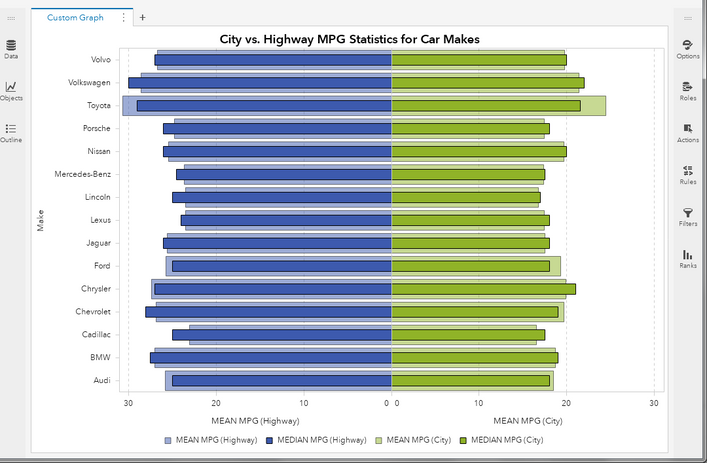
Simply click the "options" menu and change the graph's Name and Title to: "City vs. Highway MPG Statistics for Car Makes":
Also, there are a lot more bars on the bar chart then there were in the original example. It would be nice if we could suppress some of the bars. Fortunately in SAS VA 8.2 we can apply ranks to custom graphs! So we go to the ranks menu and choose to only show the Top 15 Makes by MSRP:
And we've done it! Not only have we imported our custom graph into SAS VA 8.2, but we have changed its data source, title and applied a new rank.
Customizations such as these will allow report designers to find awesome new applications in SAS VA 8.2 for the great custom graphs they have created in SAS Visual Analytics 7.4.
Don't miss out on SAS Innovate - Register now for the FREE Livestream!
Can't make it to Vegas? No problem! Watch our general sessions LIVE or on-demand starting April 17th. Hear from SAS execs, best-selling author Adam Grant, Hot Ones host Sean Evans, top tech journalist Kara Swisher, AI expert Cassie Kozyrkov, and the mind-blowing dance crew iLuminate! Plus, get access to over 20 breakout sessions.
Free course: Data Literacy Essentials
Data Literacy is for all, even absolute beginners. Jump on board with this free e-learning and boost your career prospects.


