- Home
- /
- SAS Communities Library
- /
- How to analyse timelines using PROC SQL
- RSS Feed
- Mark as New
- Mark as Read
- Bookmark
- Subscribe
- Printer Friendly Page
- Report Inappropriate Content
How to analyse timelines using PROC SQL
- Article History
- RSS Feed
- Mark as New
- Mark as Read
- Bookmark
- Subscribe
- Printer Friendly Page
- Report Inappropriate Content
Editor's note: SAS programming concepts in this and other Free Data Friday articles remain useful, but SAS OnDemand for Academics has replaced SAS University Edition as a free e-learning option. Hit the orange button below to start your journey with SAS OnDemand for Academics:
I was asked this week to create a timeline analysis for my group so we can see if there are any patterns or trends in the timeseries data. I had a heck of a time figuring out the code to “bin” my data in 10-minute increments, and so wanted to post 
Get the Data
I needed data that had repeated measures, had a datetime stamp, but was not so overly complex to make my examples difficult to follow. I found a dataset on the City of Toronto site that was perfect – calls to the City’s Information / Services line, 311. You can get the data here.
Get Started with SAS OnDemand for Academics
Getting the data ready
The data was already in a format that I could use, and there was no missing or clearly incorrect data.
The Results
My first task is to find out what the average length of time is between calls for each day.
The first thing I want to do is strip out the date from my “creation_date” variable:
proc sql;
create table work.test as
select *, datepart(creation_date) format=date8. as date
from work.import;
quit;
I’m doing this process in more steps than I normally do to highlight specific aspects. The next step is I need to assign a rank or a sequence number to each observation; I could use PROC RANK, but as I’m learning the DATA step I figured this was a good reason to use it here:
data work.test;
   set work.test;
   by date;
   retain row_number;
   if first.ID then do;
      row_number = 0;
   end;
   row_number + 1;
run;
Here’s what my data looks like after these first two steps (yes, my row_number starts at 3, and I think this is because I’ve run my DATA Step twice already; it won’t have any effect on the steps below):
Next, we want to establish the length of time between Observation 1 and 2, 2 and 3, etc. – but only for each day. Although doing the length between last call / first call of the next day makes sense, I want to keep each day separate for this example. I’m putting this first step into a new table work.test2.
proc sql;
create table work.test2 as
select month(a.date) as Month,
day(a.date) as Day,
a.creation_date as FirstDate,
b.creation_date as SecondDate,
(b.creation_date- a.creation_date)/60 as TimeDiff
    /* Because I’m keeping the comparisons within the same day,
       I can just subtract the two days and then divide by 60
       minutes to come up with the length between calls */
from work.test a , work.test b
    /* Because I’m comparing Row 1 to Row 2, I’ve found the easiest way is to
       join the table to itself. */
where
day(a.creation_date) = day(a.creation_date) and
    /* Because we’re looking at the data on a day-by-day level, I join the
       table to itself on Day and Month */
month(a.creation_date) = month(a.creation_date)
and b.row_number=a.row_number+1 ;
    /* This is ensuring I’m pulling out A B , B C , C D.
       Without this line, I’d get A B, B A, B C, C B */
quit;
The next step is to take this new work.test2 and run the query to calculate the average:
proc sql;
select
month, day,
avg(TimeDiff) as avg
from work.test2 a
group by month, day
order by month, day;
quit;
Here are the results for the first few days in January 2015:
Now let’s turn to the task that started me off – getting data into 10-minute increments and then generate some sort of timeline.
proc sql outobs=10000;
 /* To make the query run a little faster, I only want to output 10,000 rows
*/
create table work.testb as
select
datepart(creation_date) format=date. As Date, /* Pulls out just the date */
timepart(creation_date) format=time. As Time, /* Pulls out just the time */
cats(
 /* Takes the creation_date, splits it up into HOURS and MINUTES,
 and then breaks the Minutes out into the 10 minute increments.
 I also need to convert my hours and minutes to text, as I’m
concatenating
 them with a colon and so they have to be the same data type.
 The CASE statements I have are to:
 1) If the hour is less than 10, put a 0 in front
 (01:34 instead of 1:34, to ensure sorting works) round
 the minutes because (32/10)*10 is still 32;
 rounding gives me the correct 30 I’m looking for.
 2) when the minutes are less than 10, my result will look
 like 12:0 which doesn’t make sense.
 3) when the minutes are greater 55 (for example, 13:55), my
 result will look like 13:60, which also doesn’t make sense. */
(case when (round((minute(creation_date)/10))*10)=60
 then put(hour(creation_date)+1,best2.)
 when hour(creation_date)<10
 then cats('0',put(hour(creation_date),best2.))
else put(hour(creation_date),best2.) end),
':',
(case when
 round((minute(creation_date)/10))*10<10 then '00'
when round((minute(creation_date)/10))*10=60 then '00'
else put(round((minute(creation_date)/10))*10,best2.) end)) as TimeBin
from work.import;
quit;
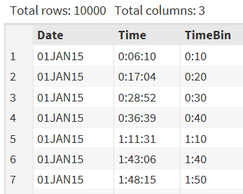
Here’s what I get:
I then put my data into a Count table because I want counts based on my time bins:
proc sql;
create table work.testc as
select TimeBin, count(*) as Count
from work.testb
group by TimeBin
order by TimeBin;
quit;
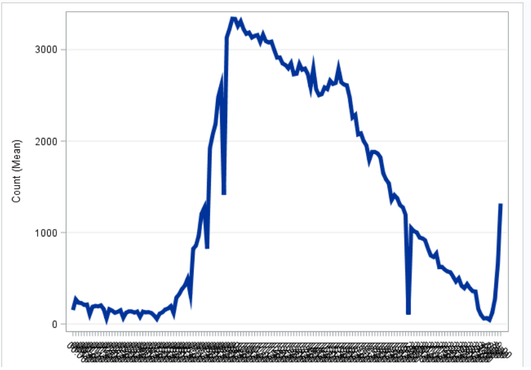
For the purposes of my time line, I pull all data (not just the 10000 from above) and I get a rather interesting graph. Further analysis would be needed to tease out the dips that are very apparent.
Now it’s your turn!
Did you find something else interesting in this data? Share in the comments. I’m glad to answer any questions.
Don't miss out on SAS Innovate - Register now for the FREE Livestream!
Can't make it to Vegas? No problem! Watch our general sessions LIVE or on-demand starting April 17th. Hear from SAS execs, best-selling author Adam Grant, Hot Ones host Sean Evans, top tech journalist Kara Swisher, AI expert Cassie Kozyrkov, and the mind-blowing dance crew iLuminate! Plus, get access to over 20 breakout sessions.
Free course: Data Literacy Essentials
Data Literacy is for all, even absolute beginners. Jump on board with this free e-learning and boost your career prospects.
Get Started
- Find more articles tagged with:
- Data for learning
- Free Data Friday


