Do you know you can do a clustering task with the Link Analysis node in SAS® Enterprise Miner™?
Using a dataset with the train/raw role, the Link Analysis node provides a cluster analysis. The node uses a community detection algorithm widely used in social network analysis for the clustering task. There are two big advantages of using the Link Analysis node as a clustering tool:
1) You can see the relationships between variables and levels of variables through the network constellation plot.
2) The number of clusters is determined automatically based on the community resolution.
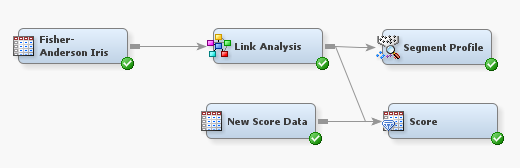
The following famous clustering example (Fisher’s Iris data) shows an outstanding result of clustering obtained using the Link Analysis node. Here is the process flow:

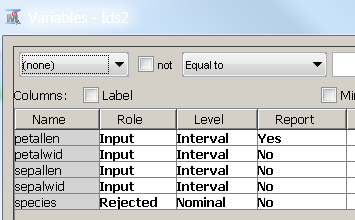
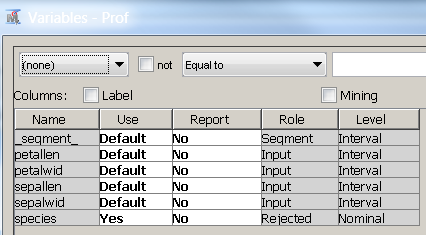
Since the species are the actual clusters, we do not use the species variable in the link analysis. So the variable settings at IDS node are as follows:
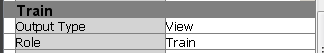
Data set role:
Variable settings:
All interval variables are binned automatically in the Link Analysis node before the clustering.
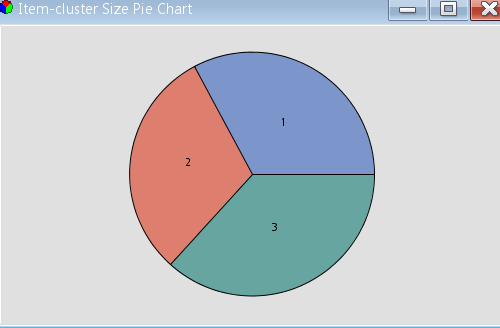
The link analysis in this example uses all the default properties. As you would expect from the Iris dataset (which contains data for three Iris species), the result shows three clusters:
The following (network) constellation plot shows which variables and which levels of each variable affect the resulting clusters.
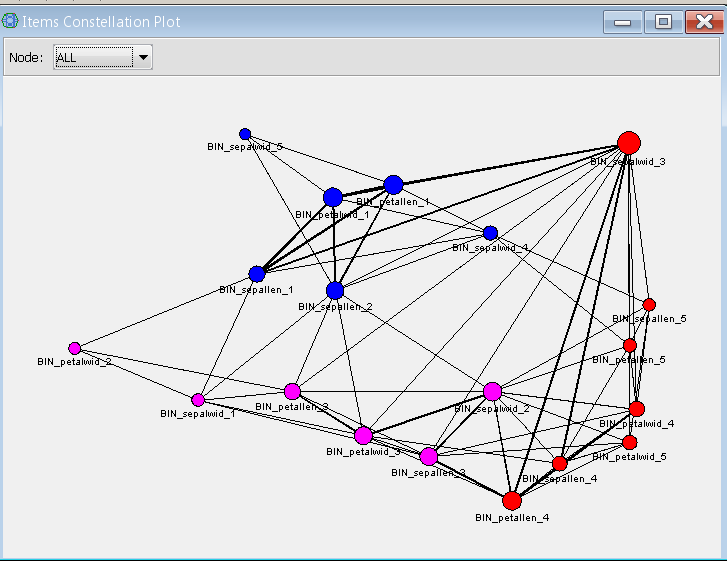
Node colors represent item clusters which are communities, as in social network analysis. Those communities are used to create the clusters among observations. So the items (variable and variable levels) will determine the resulting (observation) clusters. The node sizes represent weights for each community. The link thickness shows the transaction count which the items occurs together.
By adding the segment profile node after link analysis node, you can assess and interpret the clustering result. For this example, you need to set the Use option of the species variable to 'Yes' in the variable editor of the segment profile node, to get more details related to the true segments.
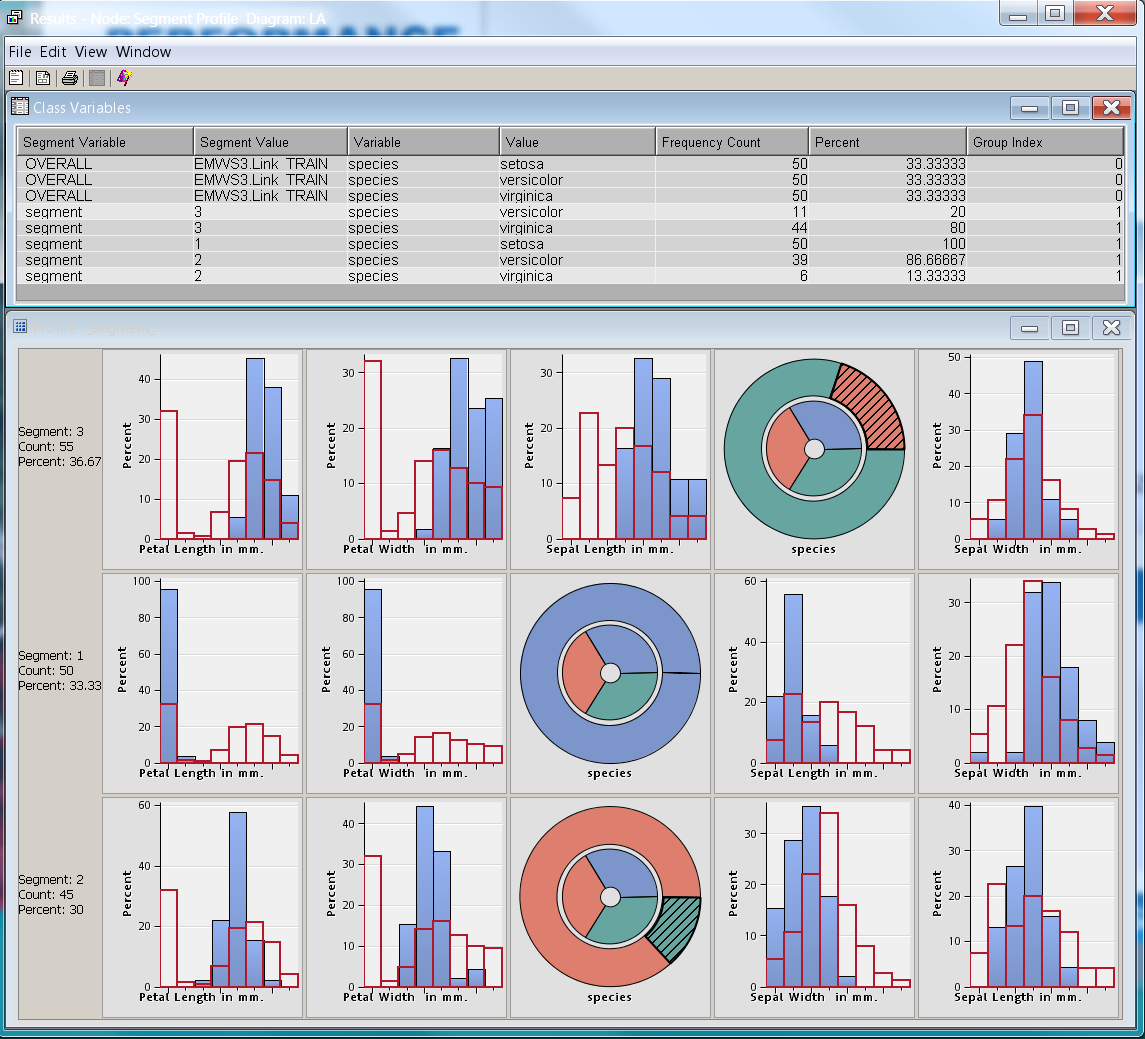
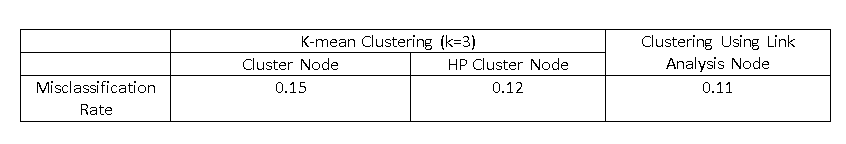
From the class variable statistics (result >> view >> summary statistics >> class variables), you can calculate the miscalculation rate which is (11+6)/150=0.11. A performance comparison of clustering with k-mean clustering shows the link analysis clustering performs well.
Finally, since the link analysis node produces score codes as a result of clustering, you can score new data sets by using the score node as follows.
As you have seen the example, the link analysis node provides an alternative clustering tool with automatic selection of the number of clusters. Unlike other standard clustering tools, it also explains how the variable and variable levels contribute to the formation of clusters.

