- Home
- /
- SAS Communities Library
- /
- How Fast are your Web Applications?
- RSS Feed
- Mark as New
- Mark as Read
- Bookmark
- Subscribe
- Printer Friendly Page
- Report Inappropriate Content
How Fast are your Web Applications?
- Article History
- RSS Feed
- Mark as New
- Mark as Read
- Bookmark
- Subscribe
- Printer Friendly Page
- Report Inappropriate Content
We've all had the experience of waiting just a bit too long (or way too long) for a web browser to load with a page that we've requested. The newest version (M3) of SAS Environment Manager gives us an easy way to monitor these applications so that we can catch problems early.
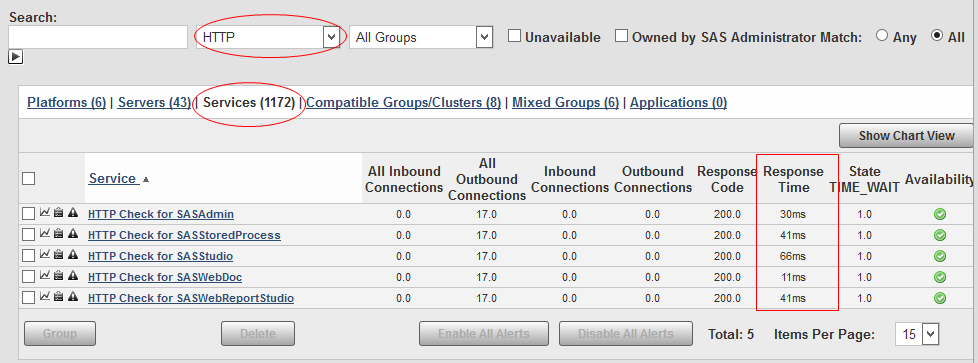
One of the easy-to-use features of the Service Architecture Framework that comes with the M3 version of SAS EV are the "HTTP check" resources, that allow you to observe the responsiveness of the web applications. If you browse to the Services level of resources, and search on the service type "HTTP", you can immediately display them, along with an easy-to read table showing the differences between them:
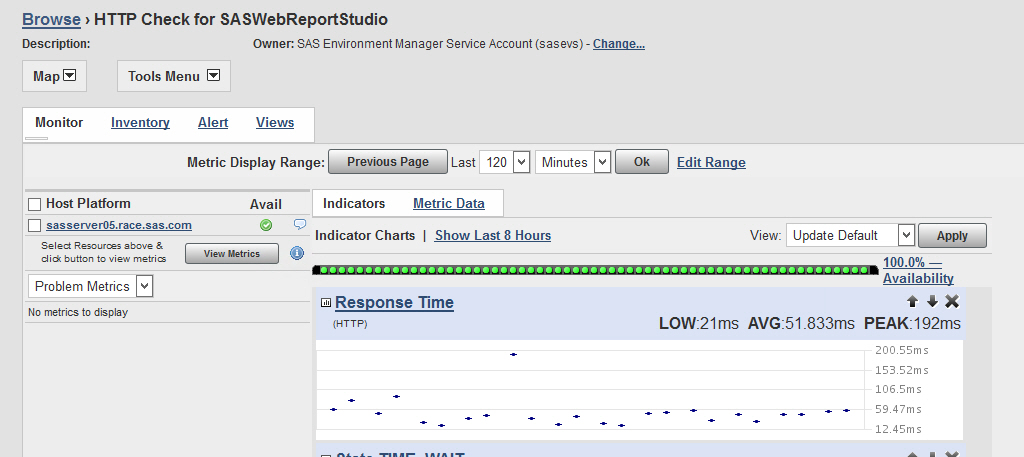
Notice that this table only shows the most recent measurment taken for each resource; if you want to see trends over time or averages, then you need to look at the individual resources on the standard timeline, from the Monitor sub-menu, as shown here:
The most interesting metrics for these resources are Response Code and Response Time. In the world of web applications, the standard response code you want to see is "200", meaning "Request was fulfilled". There are at least a couple more codes that are equally acceptable:
302 means that the request was re-directed to the correct content
304 means that the browser has cached the content and the server does not need to re-send it.
It turns out that all these "good" response codes are wrapped into a "200" by the SAS Environment Manager, so "200" is what we look for, whereas anything in the "400" or "500" range would be the red flags signifying a problem.
Response Time gives us a look at how fast the web applications are responding to users. It's not a perfect measurement however, since the HTTP Check resource is pinging the web applications as a browser would, but is not actually taking the time to load the browser. Thus the measurements are probably a bit faster than it would take to see that web page in an actual browser session. However, it's still very useful as a means of comparing the different web applications to one another, and as a way to spot trends over time, such as responses gradually slowing down.
Aside from viewing the metrics as shown, there are two ways you can display these response times in the SAS EV dashboard.
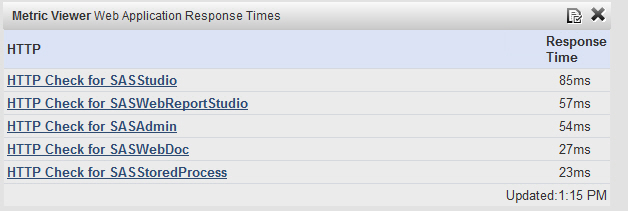
1) Use the Metric Viewer portlet, and populate it with HTTP Check resources, with Response Time as the selected metric. It will provide a sorted list of the most recent measurement for each web application:
2) Use the Saved Charts portlet, and populate it with HTTP Check resources, specifying Response Time as the metric. Here you get more information since you can see trends over time, and you can adjust the time frame using the configuration button on that portlet. Flip from one web application to the next by selecting the links, one per application, to the left of the chart.
Finally, you'll notice that by default, five of the web applications come with a ready-made HTTP Check resource. You can add HTTP Check resources for additional web applications by using the following two files: <SAS_CONFIG>/LevN/Web/SASEnvironmentManager/emi-framework/bin/create_http_checks.sh <SAS_CONFIG>/LevN/Web/SASEnvironmentManager/emi-framework/conf/http_checks.json Edit the json file, and you'll see one entry per web application. They look like this:
"name": "HTTP Check for SASStudio",
"desc": "[Auto-Generate] HTTP Monitoring URL: /SASStudio",
"enable": "true",
"method": "GET",
"port": "7980",
"sotimeout": "30",
"ssl": "false",
"platform": "midtier01.race.sas.com",
"path": "/SASStudio",
"follow": "true",
"pattern": "SASStudio"
}
All you have to do is set the "enable" parameter to "true" (3rd line) for any and all applications that you want to monitor. Save your changes, go to the .../bin directory shown above, and run the script:
./create_http_checks.sh -t /opt/sas/config/Lev1/Web/SASEnvironmentManager/emi-framework/Conf/httpChecks.json
and you'll see output indicating whether the resources were created.
As mentioned earlier, these response time measurements are most useful when you can compare several web applications against each other, or, when you can watch this metric trending over a period of time--both of which are easy to do in Environment Manager. It's also the case that web application response times provide a quick and easy proxy for other potential system problems that an administrator may want to explore--memory running low, too many jobs at once, etc.
Don't miss out on SAS Innovate - Register now for the FREE Livestream!
Can't make it to Vegas? No problem! Watch our general sessions LIVE or on-demand starting April 17th. Hear from SAS execs, best-selling author Adam Grant, Hot Ones host Sean Evans, top tech journalist Kara Swisher, AI expert Cassie Kozyrkov, and the mind-blowing dance crew iLuminate! Plus, get access to over 20 breakout sessions.
Free course: Data Literacy Essentials
Data Literacy is for all, even absolute beginners. Jump on board with this free e-learning and boost your career prospects.


