- Home
- /
- SAS Communities Library
- /
- A tweet is just a tweet...until you analyse it!
- RSS Feed
- Mark as New
- Mark as Read
- Bookmark
- Subscribe
- Printer Friendly Page
- Report Inappropriate Content
A tweet is just a tweet...until you analyse it!
- Article History
- RSS Feed
- Mark as New
- Mark as Read
- Bookmark
- Subscribe
- Printer Friendly Page
- Report Inappropriate Content
SAS programming concepts in this and other Free Data Friday articles remain useful, but SAS OnDemand for Academics has replaced SAS University Edition as a free e-learning option. Hit the orange button below to start your journey with SAS OnDemand for Academics:
I recently was asked to start exploring Twitter analysis. I must admit I was nervous as I’ve tried text analytics in the past. Beyond PERL Expressions in SQL, more complex analysis of text has always seemed like magic to me.
My good friend @Reeza provided a link to her code, which did what I needed. Now I share it with you so you can perform the same basic analyses.
Get the data
Kaggle is quickly becoming one of my favourite sites for data; this dataset is no exception. You can get the file here.
Get started with SAS OnDemand for Academics
Get the data ready
The data was a straight import into SAS University Edition. It took a little longer than normal on my computer, but that was due to the size of the dataset.
The results
Airlines have been getting pretty bad press lately, and I wanted to see if this was evident in tweets about them. There is a column called "Negative Reason Confidence" which is an indicator of how certain we can be that any tweet labelled as "Negative" is actually negative. I used a simple bar chart and set it up like so:
A couple of things to note: 1) I'm using a Where clause to limit my data output, and 2) I've selected the Show Bar Labels. When I run the task, I get the following graph:
A friend who does sentiment analysis for a company says anything over 70% indicates very strong confidence in the tone of the tweet. It's a good bet that the messages flagged as Negative are from unhappy customers. In this analysis, US Airways leads the others.
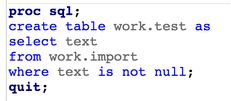
Next, I want to take a look at the actual tweets themselves. I first create a new table of just the contents of the tweet, which is in a column "Text":
Then I run it through the code generously provided by @Reeza:
This code splits the tweet text from a horizontal string and transposes it to one word per row, making analysis much easier.
With the new output, I then run two SQL queries - one for the number of times the airline was tweeted, and the second with the number of hashtags used:
United clearly gets the majority of tweets:
Here is the breakdown by hashtag; they appear to be largely referring to the Airline (#Jetblue), generic (#travel) or negative (#badservice, #neveragain).
When I have more time I'd love to explore this data more and see what other, more interesting things I can find. Suggestions for analyses are more than welcome!
Now it’s your turn!
Did you find something else interesting in this data? Share in the comments. I’m glad to answer any questions.
- Mark as Read
- Mark as New
- Bookmark
- Permalink
- Report Inappropriate Content
FYI, there are some papers on using SAS Visual Analytics to do Twitter analysis which also include network analysis which may be of interest too:
From Traffic to Twitter - Exploring Networks with SAS Visual Analytics® from @FalkoSchulz and @Nascif_SAS
Bringing Google Analytics, Facebook and Twitter Data to SAS Visual Analytics from I-Kong Fu
- Mark as Read
- Mark as New
- Bookmark
- Permalink
- Report Inappropriate Content
@MichelleHomes - very cool! One day I will play with VA, I have made that promise to myself 🙂
Hope all is well with you and the family!
Chris
- Mark as Read
- Mark as New
- Bookmark
- Permalink
- Report Inappropriate Content
#lifelearner!!!
Cheers,
Michelle
- Mark as Read
- Mark as New
- Bookmark
- Permalink
- Report Inappropriate Content
Great job!
Transform all text to uppercase (or lowercase) to further combine the hashtag frequency output?
Just a thought...
Jim
- Mark as Read
- Mark as New
- Bookmark
- Permalink
- Report Inappropriate Content
Thanks @Prof_Jim, that's a really good suggestion and one I should have thought of 🙂 If i can I'll rerun the code and update the post!
appreciate your time!
Chris
- Mark as Read
- Mark as New
- Bookmark
- Permalink
- Report Inappropriate Content
Best Regards,
Jim
SAS Innovate 2025: Register Now
Registration is now open for SAS Innovate 2025 , our biggest and most exciting global event of the year! Join us in Orlando, FL, May 6-9.
Sign up by Dec. 31 to get the 2024 rate of just $495.
Register now!
Free course: Data Literacy Essentials
Data Literacy is for all, even absolute beginners. Jump on board with this free e-learning and boost your career prospects.
Get Started
- Find more articles tagged with:
- Data for learning
- Free Data Friday


