- Home
- /
- SAS Communities Library
- /
- A point for the nice guys – red cards don’t lead to wins
- RSS Feed
- Mark as New
- Mark as Read
- Bookmark
- Subscribe
- Printer Friendly Page
- Report Inappropriate Content
A point for the nice guys – red cards don’t lead to wins
- Article History
- RSS Feed
- Mark as New
- Mark as Read
- Bookmark
- Subscribe
- Printer Friendly Page
- Report Inappropriate Content
Rough play is part of football. Some level of aggression is needed to perform well – especially at the all-time competitive level of the World Cup. But like with everything, there’s a limit. When aggressive play reaches its tipping point and red cards run wild, wins aren’t necessarily the result. And yet top-ranked Brazil has received the most red cards in World Cup history, according to Mail Online, while Australia is the ‘dirtiest,’ receiving four red cards over 10 matches.
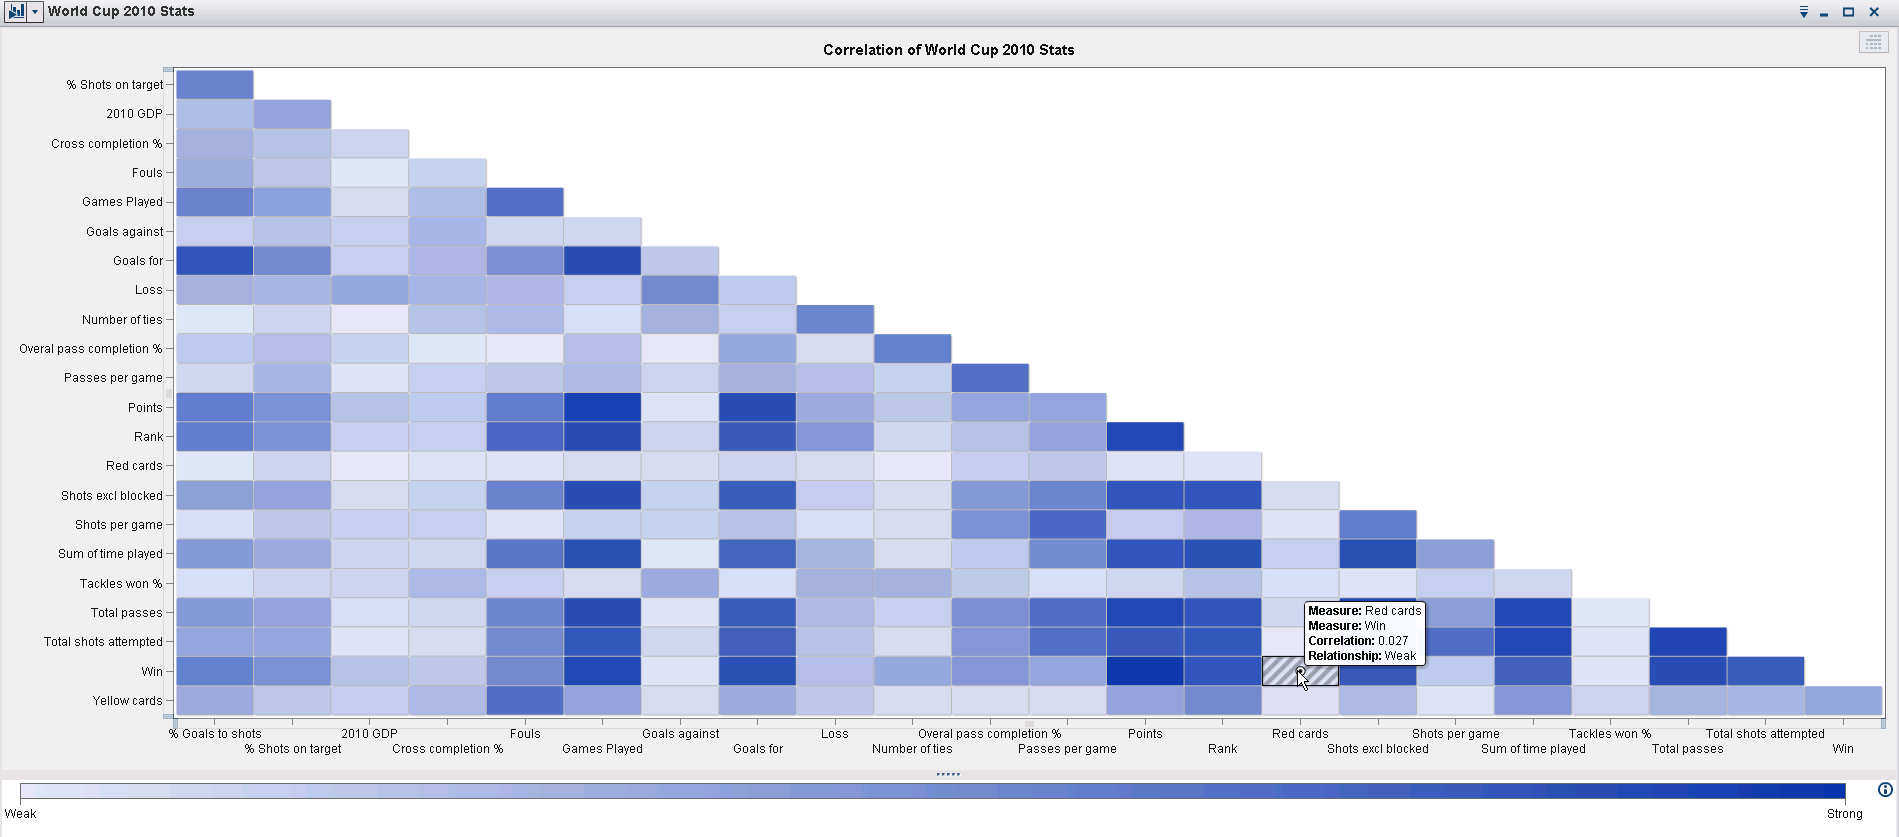
You’ll see the weak relationship between red cards and wins in the SAS Visual Analytics correlation matrix below, based on 2010 World Cup data. (This is the same matrix referenced in Who says you have to be rich to win a football game?)

Quick tip: darker color = higher correlation. The World Cup data came from The Guardian and the GDP data came from the World Bank’s public site.
Are there any other relationships of interest to you? Dive into other commentary on SAS Visual Analytics World Cup-related graphs for ideas.
Ready to join fellow brilliant minds for the SAS Hackathon?
Build your skills. Make connections. Enjoy creative freedom. Maybe change the world. Registration is now open through August 30th. Visit the SAS Hackathon homepage.
Register today!Free course: Data Literacy Essentials
Data Literacy is for all, even absolute beginners. Jump on board with this free e-learning and boost your career prospects.
Get Started
- Find more articles tagged with:
- world_cup_visualizations
