- Home
- /
- Programming
- /
- ODS Reports
- /
- Re: how to have table and multiple graphs on same sheet in excel
- RSS Feed
- Mark Topic as New
- Mark Topic as Read
- Float this Topic for Current User
- Bookmark
- Subscribe
- Mute
- Printer Friendly Page

- Mark as New
- Bookmark
- Subscribe
- Mute
- RSS Feed
- Permalink
- Report Inappropriate Content
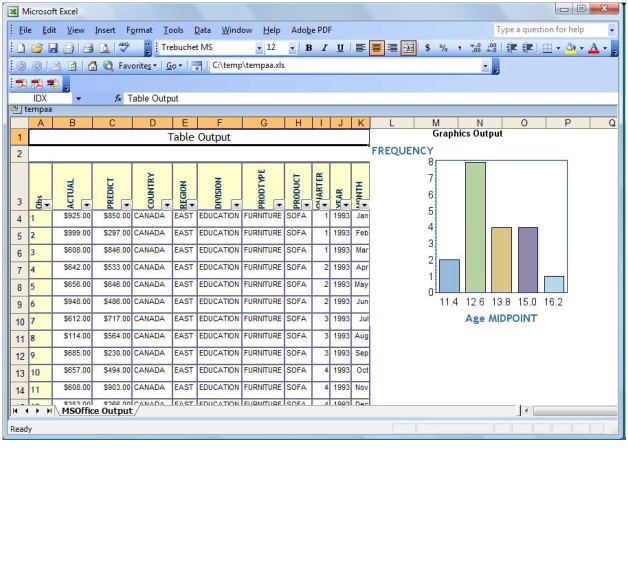
How to have table and multiple graphs on same sheet in excel. I tried tableeditor to get to that. I want to use excel graphs instead of sas graphs.
something like this and more graphs in same page and so on so forth for other sheets in same excel workbook.

- Mark as New
- Bookmark
- Subscribe
- Mute
- RSS Feed
- Permalink
- Report Inappropriate Content
Hi:
If you want "excel graphs" and not SAS graphs (which are images), then all I can think of are these methods:
1) send the data points to Excel and if your SAS and Windows/Office are on the same machine, use DDE to "draw" the Excel graphs by sending Excel DDE commands from SAS to Excel
2) send the data points to Excel and use Excel macros or VB scripts to do the graphs
3) possibly, work with Tech Support to see whether there is a way to invoke an Excel macro using one of the ODS destinations, such as MSOFFICE2K_X or TAGSETS.TABLEEDITOR (essentially the same as #2, but the Excel macro would be invoked on File--> Open.
cynthia

- Mark as New
- Bookmark
- Subscribe
- Mute
- RSS Feed
- Permalink
- Report Inappropriate Content
Will your table and graph always have the same data, ie same categories for chart and same number of rows/columns for the graph?
- Mark as New
- Bookmark
- Subscribe
- Mute
- RSS Feed
- Permalink
- Report Inappropriate Content
The table has different rows which makes the parameters to the graph. so for example months are different columns and rows will have sales data, % change from previous years, so on so forth. so one graph will have 5 bars of different parameters and onescatter plot for other parameter. so this graph will be for one product and the table has different products data. so we will see different graphs for differnt products.
- Mark as New
- Bookmark
- Subscribe
- Mute
- RSS Feed
- Permalink
- Report Inappropriate Content
I don't follow.
Is this a one time job or are you doing it repeatedly?
If so, does the table and graph change between repetitions, specifically the number of rows and columns? It doesn't matter if the information in the rows/columns change, but do the number of them change?
- Mark as New
- Bookmark
- Subscribe
- Mute
- RSS Feed
- Permalink
- Report Inappropriate Content
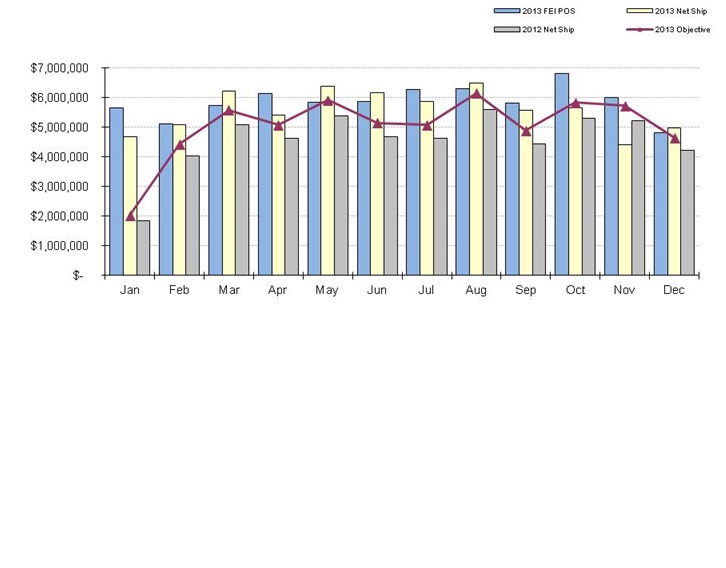 The data is on different sheets of the workbook and graphs for that data. I am putting a graph for your refernce.

- Mark as New
- Bookmark
- Subscribe
- Mute
- RSS Feed
- Permalink
- Report Inappropriate Content
What I have done before is using dynamic name range method to set up input ranges for multiple Excel charts on an Excel file (you may call it a template), for every month, I ran SAS code and used DDE to dump data on the specific ranges where the dynamic name range formula refer to. The charts, no matter where you put them, same sheet or on other sheets, will automatically pull in the data from the name ranges, which are defined by the data I put on Excel. So if I have 5 months of data, the name ranges will include 5 rows, and next month, it will include 6 rows, then this will feed into the charts. Name ranges can be set with scope of an workbook, so the input data and the chart from that data can certainly be on different sheets.
However, this method only works for adding data points for same number of data series in the chart. If you want to add new series to an existing chart, I believe it has to be done in VB way. Or if you want it to do 3 charts when there are 3 products in the data and 4 charts when there are 4 products in the data, VB mignt be the only way to go.
If the data for a specific product is situated in the same rows each time, just statically point the chart input to the the set ranges; if not, once again, you can use dynamic ranges to grab the appropriate rows from the large table for each of your product charts.
.
- Mark as New
- Bookmark
- Subscribe
- Mute
- RSS Feed
- Permalink
- Report Inappropriate Content
As a quick add on if you're exporting to a named range you can use proc export, don't need DDE.
- Mark as New
- Bookmark
- Subscribe
- Mute
- RSS Feed
- Permalink
- Report Inappropriate Content
I've never tried doing "proc export" to a named range. I remembered vaguely seeing papers talking about libname and data step to dump data in named ranges.
Would you please provide a simple example? Actually, I only DDE data to a hidden sheet, all "displayed" content in tables and named ranges are pulled from that data.
- Mark as New
- Bookmark
- Subscribe
- Mute
- RSS Feed
- Permalink
- Report Inappropriate Content
You'll have to modify the libname export, I have to use PCfiles, you may need Excel or EXCELCS depending on your setup.
First I prep the template (attached).
Second, I prep the data.
Three. Copy the template to export to.
Four. Export.
*prep data;
proc sort data=sashelp.class out=class;
by sex;
run;
%let file_name=Sample2;
*If you have x command, I copy my template and rename it for the project at hand;
%sysexec copy
"C:\Temp\Sample.xlsx"
"C:\Temp\&file_name..xlsx";
*Range is called sashelp_class;
libname example pcfiles path=""C:\Temp\&file_name..xlsx";
proc sql;
drop table example.sashelp_class;
quit;
data example.sashelp_class;
set class;
if age<15 then height=height*2;
run;
libname example;
.jpg")
Catch up on SAS Innovate 2026
Nearly 200 sessions are now available on demand with the SAS Innovate Digital Pass.
Explore Now →Learn how use the CAT functions in SAS to join values from multiple variables into a single value.

Find more tutorials on the SAS Users YouTube channel.
SAS Training: Just a Click Away
Ready to level-up your skills? Choose your own adventure.
-
9 replies
-
11-19-2013 06:45 PM
-
9496 views
-
0 likes
-
4 in conversation
-
