- Home
- /
- Programming
- /
- ODS Reports
- /
- Re: Title in png extra spacing and Titles combined
- RSS Feed
- Mark Topic as New
- Mark Topic as Read
- Float this Topic for Current User
- Bookmark
- Subscribe
- Mute
- Printer Friendly Page

- Mark as New
- Bookmark
- Subscribe
- Mute
- RSS Feed
- Permalink
- Report Inappropriate Content
This is really two questions in one. I'm creating a png using an SGPLOT and am having a problem with my titles.
Title one comes out at the top but has a great deal of space after it before Title2. Then Title2 and Title3 are being combined on the same line.
Below is the code I'm using:
%IF &FILENM = SHARED %THEN %DO ;
Title1 'CPC Shared Processor Engine Pools-LPAR Configuration';
%END;
%ELSE %DO;
title1 'CPC Dedicated Processor Engine Pools-LPAR Configuration' ;
%END;
TITLE2 '#BYVAR(1) #BYVAL(1)';
TITLE3 '#BYVAR(2) #BYVAL(2)';
PROC SGPLOT DATA=WORK.&FILENM UNIFORM=YSCALE ;
BY CPCID DATE ;
VBAR PRSMLPNM / RESPONSE=LPCAVCPU BARWIDTH=.16
DATASKIN=none ;
...
Below is the resulting chart.
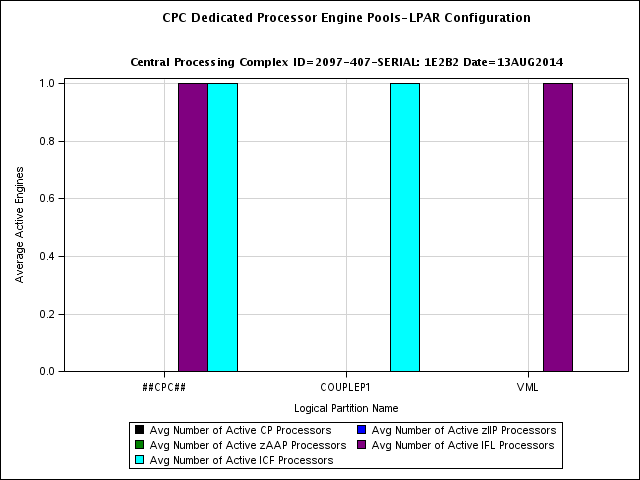
Any thoughts would be greatly appreciated.
Rodney

- Mark as New
- Bookmark
- Subscribe
- Mute
- RSS Feed
- Permalink
- Report Inappropriate Content
Target destination? Are you sending this to PDF, RTF or HTML? Also which STYLE are you using?
And by any chance to you have a combination of data such that your first BY variable is missing when the second isn't?
Does this happen for all of the charts or just the first couple? That might lead me to strongly suspect the first BY variable is either blank or missing.
- Mark as New
- Bookmark
- Subscribe
- Mute
- RSS Feed
- Permalink
- Report Inappropriate Content
1. HTML
2. I was using the default style, but am now using a custom style, but it didn't have any impact.
3. No, The first BY variable is alway present. I did a PROC PRINT just to make sure.
4. It happens on all the charts.
Here is the style stuff relating to the titles:
STYLE FONTS FROM FONTS /
"TITLEFONT2" = ("VERDANA, VERDANA, HELVETICA, SANS-SERIF",14PT,BOLD);
STYLE GRAPHFONTS FROM _SELF_/
"GRAPHTITLEFONT" = ("MICROSOFT SANS SERIF",9.5PT, BOLD)
"GRAPHTITLEFONT2" = ("ARIAL",10PT, BOLD)
"GRAPHVALUEFONT" = ("ARIAL",8.25PT,NORMAL)
"GRAPHLABELFONT" = ("ARIAL",8.25PT,NORMAL)
"GRAPHFOOTNOTEFONT" = ("ARIAL",8.25PT,ITALIC);
Rodney
- Mark as New
- Bookmark
- Subscribe
- Mute
- RSS Feed
- Permalink
- Report Inappropriate Content
1. HTML
2. I was using the default style, but am now using a custom style, but it didn't have any impact.
3. No, The first By variable is alway present.Use advanced editor4. It happens on all the charts.
Here is the style stuff relating to the titles:
STYLE FONTS FROM FONTS /
"TITLEFONT2" = ("VERDANA, VERDANA, HELVETICA, SANS-SERIF",14PT,BOLD);
STYLE GRAPHFONTS FROM _SELF_/
"GRAPHTITLEFONT" = ("MICROSOFT SANS SERIF",9.5PT, BOLD)
"GRAPHTITLEFONT2" = ("ARIAL",10PT, BOLD)
"GRAPHVALUEFONT" = ("ARIAL",8.25PT,NORMAL)
"GRAPHLABELFONT" = ("ARIAL",8.25PT,NORMAL)
"GRAPHFOOTNOTEFONT" = ("ARIAL",8.25PT,ITALIC);
- Mark as New
- Bookmark
- Subscribe
- Mute
- RSS Feed
- Permalink
- Report Inappropriate Content
Something I've noticed. Title2 and Title3 are not coming out at all, that is actually what the blank lines are and the line I'm getting seems to be auto generated somehow...
- Mark as New
- Bookmark
- Subscribe
- Mute
- RSS Feed
- Permalink
- Report Inappropriate Content
To suppress the automatic by line:
options nobyline; before the proc and turn back on afterwards with options byline.
.jpg")
Catch up on SAS Innovate 2026
Nearly 200 sessions are now available on demand in the Innovate Hub.
Watch Now →Learn how use the CAT functions in SAS to join values from multiple variables into a single value.

Find more tutorials on the SAS Users YouTube channel.
SAS Training: Just a Click Away
Ready to level-up your skills? Choose your own adventure.
-
5 replies
-
09-05-2014 12:57 PM
-
2656 views
-
0 likes
-
2 in conversation
-
