- Home
- /
- Programming
- /
- ODS Reports
- /
- Re: SAS Dashboard
- RSS Feed
- Mark Topic as New
- Mark Topic as Read
- Float this Topic for Current User
- Bookmark
- Subscribe
- Mute
- Printer Friendly Page

- Mark as New
- Bookmark
- Subscribe
- Mute
- RSS Feed
- Permalink
- Report Inappropriate Content
I have a project need to build SAS dashboard. We only have PC SAS 9.3 and Enterprise Guide 5.1. I tried the dashboard sample codes on the SAS website.http://robslink.com/SAS/democd19/sfew.sas
I can’t seem to get customized codes. .By altering the codes, it doesn’t work out I get stuck at the annotation part.
Anyone has some experience or reference for SAS dashboard?
Thanks

- Mark as New
- Bookmark
- Subscribe
- Mute
- RSS Feed
- Permalink
- Report Inappropriate Content
does "SAS/Graph" appear in the log if you run
proc setinit; run;
- Mark as New
- Bookmark
- Subscribe
- Mute
- RSS Feed
- Permalink
- Report Inappropriate Content
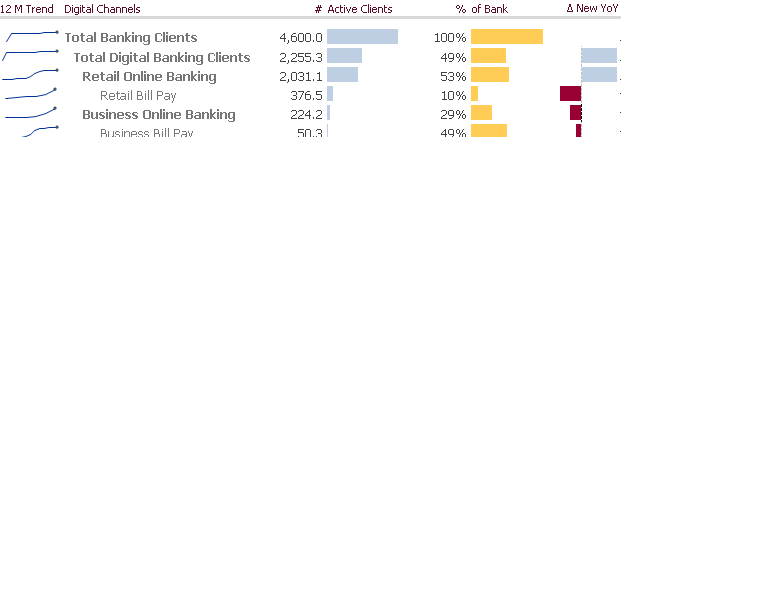
I have SAS/Graph package. the hard part is how to combine the bar chart and the numbers together
the sample data code:
data plot1_data;
input digital_channels $ 1-25 ActiveClients PctOfBank pct_new_YoY;
cards;
Total Banking Clients 4600000 1 0.3
Total Digital Banking 2255300 0.490282609 0.5
Retail 2031084 0.526249733 0.19
Retail Bill Pay 376458 0.097539502 -1.77
Business 224167 0.294097119 0.06
Business Bill Pay 50299 0.493896127 -3.45
Mobile 1051132 0.228506957 -0.04
App 707607 0.153827609 0.24
Mobile Web 442856 0.096273043 -0.004067451
SMS 71008 0.015436522 0.015437697
;
run;
data plot1_data; set plot1_data;
sortorder=_n_;
PCT_Bank2=int(PctOfBank*100);
pct_new_YoY2=int(pct_new_YoY*100);
run;
I tried to use annotate macros and SAS/GRAPH's annotate facility to create the following part except 12-month spike line.

- Mark as New
- Bookmark
- Subscribe
- Mute
- RSS Feed
- Permalink
- Report Inappropriate Content
Hi:
When you work with programs from the ROBSLINK web site, you can get all the code working, with just a few changes. But it's hard to change the ANNOTATE to suit your data, if you don't understand ANNOTATE. This forum is generally for tabular reports produced with ODS and Base SAS Reporting procedures (like REPORT and TABULATE). SAS/GRAPH has its own forum and the people who use and understand ANNOTATE, including Dr. Rob Allison (the author of the ROBSLINK web site) generally answer questions over in that forum.
So, you might be better served by posting your question over there. However, seeing a picture isn't as much help as seeing your code and providing some test data for other folks to work with. If people have to make up some fake data and then write the entire program to help you, they might not have the time to put in that much work. But if you make it easy for them to run a program, by providing your code and a sample of your data, then you are likely to get more responses.
The SAS/GRAPH and ODS Graphics forum is here: https://communities.sas.com/community/support-communities/sas_graph_and_ods_graphics and since you are really asking a SAS/GRAPH and ANNOTATE question, your question would be better posted over there.
cynthia
.jpg")
Catch up on SAS Innovate 2026
Nearly 200 sessions are now available on demand with the SAS Innovate Digital Pass.
Explore Now →Learn how use the CAT functions in SAS to join values from multiple variables into a single value.

Find more tutorials on the SAS Users YouTube channel.
SAS Training: Just a Click Away
Ready to level-up your skills? Choose your own adventure.
-
3 replies
-
08-07-2014 09:21 AM
-
2972 views
-
3 likes
-
3 in conversation
-
