- Home
- /
- Programming
- /
- ODS Reports
- /
- PROC TABULATE and ODS PDF Woes
- RSS Feed
- Mark Topic as New
- Mark Topic as Read
- Float this Topic for Current User
- Bookmark
- Subscribe
- Mute
- Printer Friendly Page

- Mark as New
- Bookmark
- Subscribe
- Mute
- RSS Feed
- Permalink
- Report Inappropriate Content
Here is the code
ods pdf file='z:\HLS\demo.pdf' ;
proc tabulate data=sashelp.class order=formatted ;
class sex age ;
var height weight ;
table mean='' * f=6.
,
(age='' all) * (sex='' all)
,
height weight
/
box= 'Averages by Age and Sex' ;
run ;
ods pdf close ;
and the result
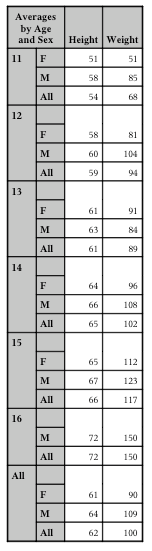
Notice that for each age level after the first (11), there is an extra space-wasting box above the sex levels. Why? Can this be avoided? I experimented with the listing, HTML, and RTF destinations and did not get this behavior.
There's more. In the course of experimenting, I turned on the row=float option
ods pdf file='z:\HLS\demo.pdf' ;
proc tabulate data=sashelp.class order=formatted ;
class sex age ;
var height weight ;
table mean='' * f=6.
,
(age='' all) * (sex='' all)
,
height weight
/
box= 'Averages by Age and Sex' row=float ;
run ;
ods pdf close ;
Output was
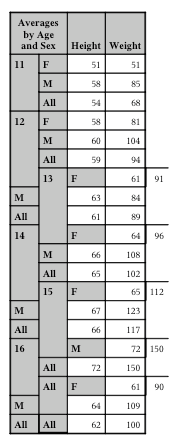
Scary, no?
Accepted Solutions
- Mark as New
- Bookmark
- Subscribe
- Mute
- RSS Feed
- Permalink
- Report Inappropriate Content
That was quick; tech support's response arrived this morning.
The essence: It's a known issue. To work around, code the TABLE statement option INDENT=0.
Once I knew to include INDENT in my search string, I located four pertinent or at least similar SAS notes.
2001-11-28
4438 - PROC TABULATE creates a blank row in HTML/RTF/PDF output- Problem Note
PROC TABULATE may create a blank row in HTML, PDF, and RTF output. This occurs when a CLASS variable is crossed with a statistic in the row dimension and the CLASS variable heading is blanked out. The listing output ...
2010-03-17
38296 - First row of a PROC TABULATE table is repeated at the top of each PDF page- Problem Note
The first row of a PROC TABULATE table is repeated at the top of each PDF page.
2006-04-25
16880 - TABULATE output may shift in non-LISTING destinations- Problem Note
If an analysis variable comes before a CLASS variable in a TABLE crossing, and a format that applies to the table cells is crossed with the CLASS variable, the output created in HTML, PDF or RTF may show a shifted row. ...
2009-04-29
35204 - PROC TABULATE might create a blank row in the ODS PRINTER (PCL/PDF/PS) output destinations- Problem Note
PROC TABULATE might create a blank row in the ODS PRINTER (PCL/PDF/PS) output destinations when multiple CLASS variables are crossed within the row dimension and their labels are blank.

- Mark as New
- Bookmark
- Subscribe
- Mute
- RSS Feed
- Permalink
- Report Inappropriate Content
Hi:
Well, ROW=FLOAT is only useful when you have the statistic in the row dimension, which is not the case for your report, so I am not sure why PDF is acting so funny. I don't understand why you have the MEAN statistic in the page dimension. That doesn't make sense to me anyway.
Also, I don't understand why you have
(age all) * (sex all) instead of the more common (age *(sex all) all).
But at any rate, I don't know what you can do to suppress the extra row header space that you are getting in your first code example. However, if you wanted to simplify the table, then my suggestion is that either you work with Tech Support on the TABULATE issue or you could consider switching to PROC REPORT, which will do what you want without needing to worry about the extra row headers.
cynthia

- Mark as New
- Bookmark
- Subscribe
- Mute
- RSS Feed
- Permalink
- Report Inappropriate Content
The example can be further simplified to a more conventional use of TABULATE and still show a buggy format in PDF:
ods pdf file="&sasforum.\Reports\Howles_demo.pdf";
proc tabulate data=sashelp.class;
class sex age ;
var weight ;
table
(age=" " * (sex=" " all) all)
,
weight*mean=" ";
run ;
ods pdf close ;
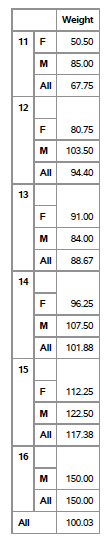
The only way to get rid of the extra cells is to remove the ALL row specifications.
PG

- Mark as New
- Bookmark
- Subscribe
- Mute
- RSS Feed
- Permalink
- Report Inappropriate Content
The ironic thing is the listing destination is working .
Xia Keshan

- Mark as New
- Bookmark
- Subscribe
- Mute
- RSS Feed
- Permalink
- Report Inappropriate Content
I am surprised, there seems to be a flurry of these proc tabulate questions this week, not having used it for decades I thought this proc had gone away. Anyways, my suggestion use the out= statement from the proc tabulate if you have to use that, then post process your dataset as you want and proc report the result. Report procedure gives you much more flexibility over the produced output.
- Mark as New
- Bookmark
- Subscribe
- Mute
- RSS Feed
- Permalink
- Report Inappropriate Content
Hi:
Well, PROC TABULATE certainly has NOT gone away. It is very popular for grouping cross-tabs by classifier variables and EG has a lovely task that allows folks to drag and drop their vars into the rows and columns of the table.. The behavior with PDF is odd and probably a defect that needs to be reported to Tech Support. I do not remember that behavior with ODS PDF in earlier releases of SAS, so the behavior now is odd. At any rate, the OP can do what he wants with PROC REPORT.
My only caveat about using OUT= with TABULATE is that the structure of the output table is "flattened" and is no longer cross-tabular in nature, so it's not as simple as doing an OUT= followed by a PROC PRINT. For example, consider this out= compared to the original tabulate compared to using PROC REPORT.
Cynthia
** get smaller subset and make sex variable longer;
data class;
length sex $11;
set sashelp.class;
where age le 13;
run;
ods pdf file="c:\temp\tab_out_demo.pdf" style=printer;
proc tabulate data=class out=tabout;
title '1a) TABULATE output crosstab';
class sex age ;
var height weight ;
table (age=" " * (sex=" " all) all),
height*mean=' ' weight*mean=" "
/box= 'Averages by Age and Sex' ;
run ;
proc print data=tabout;
title '1b) output dataset from TABULATE';
run;
proc report data=class nowd spanrows
style(summary)=Header;
title '2) Using PROC REPORT';
column ('Averages by Age and Sex' age sex) ("Height" height) ( "Weight" weight) ("Count" n);
define age / group ' ' style(column)=Header;
define sex / group ' ' style(column)=Header;
define height / mean f=6. ' ';
define weight / mean f=6. ' ';
define n / ' ';
compute sex;
if upcase(_break_) = 'AGE' then sex = 'Total';
else if upcase(_break_) = '_RBREAK_' then sex = 'Grand Total';
endcomp;
break after age / summarize suppress;
rbreak after/ summarize;
run;
ods pdf close ;
- Mark as New
- Bookmark
- Subscribe
- Mute
- RSS Feed
- Permalink
- Report Inappropriate Content
And another ironic thing is HTML destination also is working .
ods html file="c:\temp\Howles_demo.htm";
proc tabulate data=sashelp.class;
class sex age ;
var weight ;
table
      (age=" " * (sex=" " all) all)
      ,
      weight*mean=" ";
run ;
ods html close ;
Xia Keshan
- Mark as New
- Bookmark
- Subscribe
- Mute
- RSS Feed
- Permalink
- Report Inappropriate Content
Hi:
And, because the other destinations "work" and PDF has an issue, to me that is an oddity that needs to be investigated by Tech Support. If they can verify that it is a bug that they can reliably replicate, then they can open a defect with the developers to investigate and if there's a workaround, they'll publish a Tech Support note. If nobody closes the loop with Tech Support, the problem will never get fixed.
cynthia
- Mark as New
- Bookmark
- Subscribe
- Mute
- RSS Feed
- Permalink
- Report Inappropriate Content
Thanks for the help. I just turned in a Tech Support form.
A couple of workarounds occur to me.
(1) Get rid of the ALL keywords and use multilevel labels to build totals.
(2) Use RTF destination then use MS WORD to print to PDF
But my real code is a lot more complicated than the example I presented, so I think either of these workarounds would get messy.
Responses to other comments:
Why place a stat keyword and its format in the page dimension? Why not? It simplifies the row and/or column expressions.
Why not use PROC REPORT? I'm not sure it has all the features I need for my real project.
- Mark as New
- Bookmark
- Subscribe
- Mute
- RSS Feed
- Permalink
- Report Inappropriate Content
Hi,
As much as I love PROC TABULATE, (since it was the first real reporting procedure I used other than PROC PRINT), my vote would be to do your report with PROC REPORT. The loss of the big BOX area for TABULATE is easily made up for by the ability to make spanning column headers that can "approximate" the box.
cynthia
- Mark as New
- Bookmark
- Subscribe
- Mute
- RSS Feed
- Permalink
- Report Inappropriate Content
That was quick; tech support's response arrived this morning.
The essence: It's a known issue. To work around, code the TABLE statement option INDENT=0.
Once I knew to include INDENT in my search string, I located four pertinent or at least similar SAS notes.
2001-11-28
4438 - PROC TABULATE creates a blank row in HTML/RTF/PDF output- Problem Note
PROC TABULATE may create a blank row in HTML, PDF, and RTF output. This occurs when a CLASS variable is crossed with a statistic in the row dimension and the CLASS variable heading is blanked out. The listing output ...
2010-03-17
38296 - First row of a PROC TABULATE table is repeated at the top of each PDF page- Problem Note
The first row of a PROC TABULATE table is repeated at the top of each PDF page.
2006-04-25
16880 - TABULATE output may shift in non-LISTING destinations- Problem Note
If an analysis variable comes before a CLASS variable in a TABLE crossing, and a format that applies to the table cells is crossed with the CLASS variable, the output created in HTML, PDF or RTF may show a shifted row. ...
2009-04-29
35204 - PROC TABULATE might create a blank row in the ODS PRINTER (PCL/PDF/PS) output destinations- Problem Note
PROC TABULATE might create a blank row in the ODS PRINTER (PCL/PDF/PS) output destinations when multiple CLASS variables are crossed within the row dimension and their labels are blank.
- Mark as New
- Bookmark
- Subscribe
- Mute
- RSS Feed
- Permalink
- Report Inappropriate Content
Great work Howles. This is so old it should be called a feature, not a bug! :smileylaugh:
.jpg")
Catch up on SAS Innovate 2026
Nearly 200 sessions are now available on demand in the Innovate Hub.
Watch Now →Learn how use the CAT functions in SAS to join values from multiple variables into a single value.

Find more tutorials on the SAS Users YouTube channel.
SAS Training: Just a Click Away
Ready to level-up your skills? Choose your own adventure.
-
11 replies
-
08-31-2014 04:27 PM
-
8220 views
-
6 likes
-
5 in conversation
-
