- Home
- /
- Programming
- /
- ODS Reports
- /
- PROC REPORT removing random values from ORDER variable
- RSS Feed
- Mark Topic as New
- Mark Topic as Read
- Float this Topic for Current User
- Bookmark
- Subscribe
- Mute
- Printer Friendly Page

- Mark as New
- Bookmark
- Subscribe
- Mute
- RSS Feed
- Permalink
- Report Inappropriate Content
So, I have a simple table that I would like to present using the following code:
proc report nowd data=wt_anly_cmp;
  column Campus cohort coh_pct Withdrawals wd_rate sig pct_ratio excess wd_Rate_py Pct_Ratio_py;
  define sig /left;
  define excess /order order=internal descending;
  define wd_rate /style(column)={backgroundcolor=verylightgray};
  run;
Unfortunately, when I run the report, some values in the sorted column disappear (EXCESS in line 04). Note that the observations are in the correct sort order that the values not gone missing. I have tried changing the ORDER variable, and it repeats itself, seemingly randomly removing values from the new ORDER variable after properly sorting the observations. I tried applying a format in the DEFINE statement to no avail, and changing the ORDER variable moves the removed values to different rows, so I really don't know what is causing the problem.
Accepted Solutions

- Mark as New
- Bookmark
- Subscribe
- Mute
- RSS Feed
- Permalink
- Report Inappropriate Content
Hi:
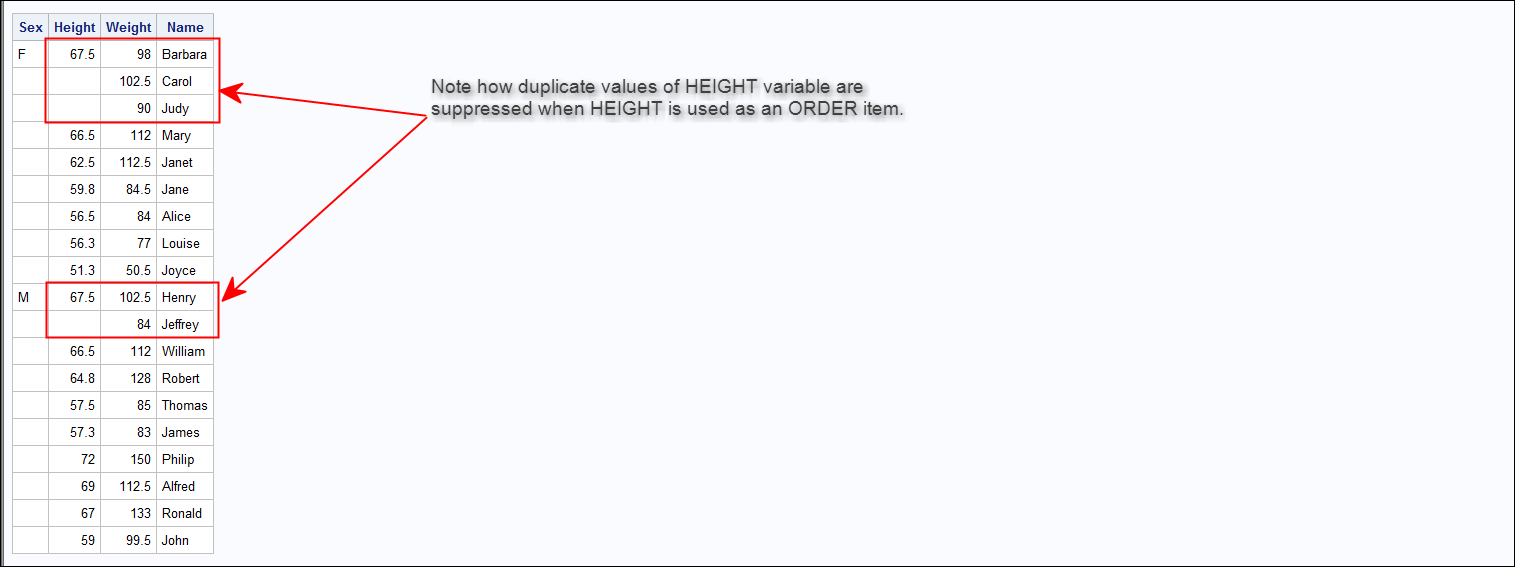
If you define EXCESS as an ORDER, then the repetitious display of values will be suppressed. For example, this code:
data class;
set sashelp.class;
** make some people the same height;
if name in ('Barbara', 'Judy', 'Carol','Henry', 'Jeffrey')
then height = 67.5;
run;
proc report data=class nowd;
title '1) Default Behavior';
column sex height weight name;
define sex / order;
define height / order descending;
define weight / display;
define name / display;
run;
proc report data=class nowd;
title '2) Changed Behavior using a COMPUTEd item';
column sex height showht weight name;
define sex / order;
define height / order descending;
define showht / computed;
define weight / display;
define name / display;
compute showht;
if height ne . then do;
holdit = height;
showht = height;
end;
else if height = . then showht=holdit;
endcomp;
run;
Produces these results:
Default:
Using Compute Block:
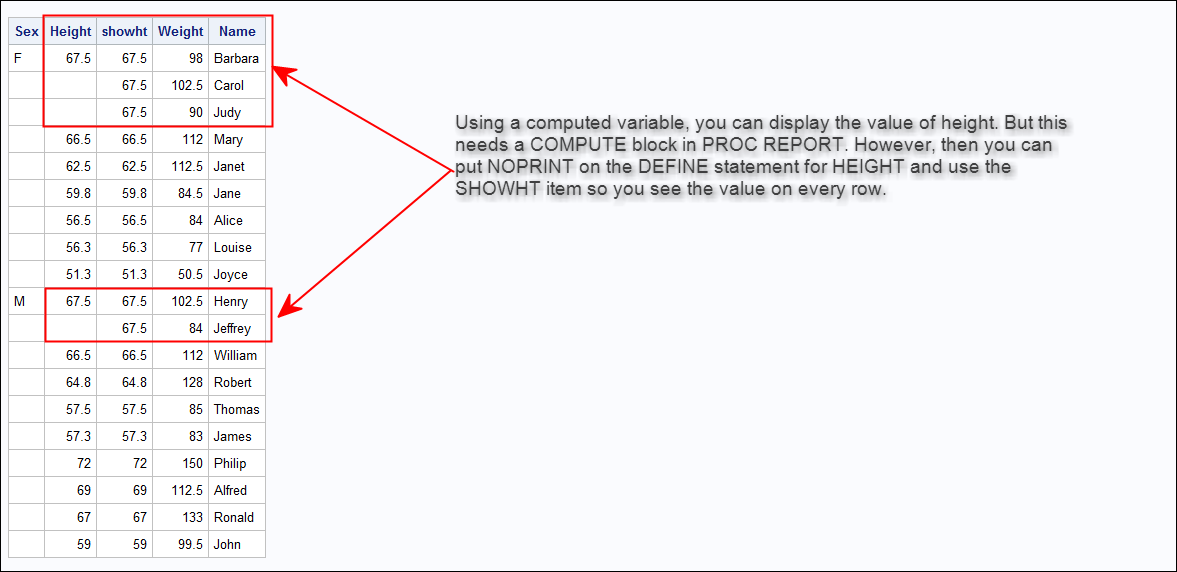

- Mark as New
- Bookmark
- Subscribe
- Mute
- RSS Feed
- Permalink
- Report Inappropriate Content
Some input data, the results you are getting and the desired results would be helpful. Also, are there any warnings or notes about that variable in the log?
- Mark as New
- Bookmark
- Subscribe
- Mute
- RSS Feed
- Permalink
- Report Inappropriate Content
No warnings or notes. Here is my data (campus information removed).
| Campus | TERM_CODE | _TYPE_ | _PAGE_ | _TABLE_ | Cohort | CPct | Withdrawals | wd_Rate | Pct_Ratio | Excess | wd_Rate_py | Pct_Ratio_py | coh_pct | z | pval | sig |
| A | 201530 | 11 | 1 | 1 | 162 | 2.067909114 | 17 | 10.49% | 0.77 | -5 | 17.97% | 0.91 | 2.07% | -1.202384487 | 0.229214597 | |
| B | 201530 | 11 | 1 | 1 | 291 | 3.714577483 | 48 | 16.49% | 1.20 | 8 | 17.54% | 0.89 | 3.71% | 1.407764708 | 0.159200754 | |
| C | 201530 | 11 | 1 | 1 | 268 | 3.420985448 | 24 | 8.96% | 0.65 | -13 | 11.20% | 0.57 | 3.42% | -2.302439201 | 0.021310416 | * |
| D | 201530 | 11 | 1 | 1 | 350 | 4.467704876 | 54 | 15.43% | 1.13 | 6 | 23.80% | 1.20 | 4.47% | 0.956622055 | 0.338758053 | |
| E | 201530 | 11 | 1 | 1 | 427 | 5.450599949 | 49 | 11.48% | 0.84 | -10 | 23.05% | 1.16 | 5.45% | -1.380257352 | 0.167507421 | |
| F | 201530 | 11 | 1 | 1 | 334 | 4.263466939 | 66 | 19.76% | 1.44 | 20 | 27.51% | 1.39 | 4.26% | 3.285809914 | 0.001016896 | ** |
| G | 201530 | 11 | 1 | 1 | 328 | 4.186877713 | 37 | 11.28% | 0.82 | -8 | 13.21% | 0.67 | 4.19% | -1.306560091 | 0.191362158 | |
| H | 201530 | 11 | 1 | 1 | 284 | 3.625223385 | 46 | 16.20% | 1.18 | 7 | 22.68% | 1.15 | 3.63% | 1.24153184 | 0.214409343 | |
| I | 201530 | 11 | 1 | 1 | 436 | 5.565483789 | 58 | 13.30% | 0.97 | -2 | 20.09% | 1.01 | 5.57% | -0.254069736 | 0.799441683 | |
| J | 201530 | 11 | 1 | 1 | 314 | 4.008169517 | 48 | 15.29% | 1.12 | 5 | 21.32% | 1.08 | 4.01% | 0.829281128 | 0.406945347 | |
| K | 201530 | 11 | 1 | 1 | 468 | 5.973959663 | 132 | 28.21% | 2.06 | 68 | 34.68% | 1.75 | 5.97% | 9.401931993 | 5.35702E-21 | *** |
| L | 201530 | 11 | 1 | 1 | 302 | 3.854991065 | 13 | 4.30% | 0.31 | -28 | 12.46% | 0.63 | 3.85% | -4.845869048 | 1.26059E-06 | *** |
| M | 201530 | 11 | 1 | 1 | 1,321 | 16.86239469 | 263 | 19.91% | 1.45 | 82 | 22.19% | 1.12 | 16.86% | 7.184604394 | 6.74021E-13 | *** |
| N | 201530 | 11 | 1 | 1 | 398 | 5.080418688 | 42 | 10.55% | 0.77 | -13 | 14.79% | 0.75 | 5.08% | -1.87922317 | 0.060214027 | |
| O | 201530 | 11 | 1 | 1 | 436 | 5.565483789 | 41 | 9.40% | 0.69 | -19 | 15.15% | 0.77 | 5.57% | -2.68975212 | 0.007150511 | ** |
| P | 201530 | 11 | 1 | 1 | 26 | 0.331886648 | 3 | 11.54% | 0.84 | -1 | 16.00% | 0.81 | 0.33% | -0.322367117 | 0.747174592 | |
| Q | 201530 | 11 | 1 | 1 | 377 | 4.812356395 | 26 | 6.90% | 0.50 | -26 | 16.84% | 0.85 | 4.81% | -3.941794892 | 8.08741E-05 | *** |
| R | 201530 | 11 | 1 | 1 | 303 | 3.867755936 | 37 | 12.21% | 0.89 | -5 | 29.31% | 1.48 | 3.87% | -0.77330628 | 0.43934114 | |
| S | 201530 | 11 | 1 | 1 | 454 | 5.795251468 | 42 | 9.25% | 0.67 | -20 | 14.52% | 0.73 | 5.80% | -2.845430717 | 0.004435141 | ** |
| T | 201530 | 11 | 1 | 1 | 555 | 7.084503447 | 28 | 5.05% | 0.37 | -48 | 9.69% | 0.49 | 7.08% | -6.156339973 | 7.44453E-10 | *** |
And the result I'm seeing. No warnings or notes in the log. Note the blanks in the Excess column for campuses R and N, highlighted in red below. I did just notice that the formatted values for these entries are exactly the same as the line before it (-5 and -13, respectively). On a whim, I just tried adding the SHOWALL option to the PROC line with no effect, unfortunately.
| Campus | Cohort | Percent of Cohort | Withdrawals | Withdrawal Rate | Signif | Percent Ratio | Excess | Prior Year Withdrawal Rate | Prior Year Percent Ratio |
| M | 1,321 | 16.86% | 263 | 19.91% | *** | 1.45 | 82 | 22.19% | 1.12 |
| K | 468 | 5.97% | 132 | 28.21% | *** | 2.06 | 68 | 34.68% | 1.75 |
| F | 334 | 4.26% | 66 | 19.76% | ** | 1.44 | 20 | 27.51% | 1.39 |
| B | 291 | 3.71% | 48 | 16.49% | 1.20 | 8 | 17.54% | 0.89 | |
| H | 284 | 3.63% | 46 | 16.20% | 1.18 | 7 | 22.68% | 1.15 | |
| D | 350 | 4.47% | 54 | 15.43% | 1.13 | 6 | 23.80% | 1.20 | |
| J | 314 | 4.01% | 48 | 15.29% | 1.12 | 5 | 21.32% | 1.08 | |
| P | 26 | 0.33% | 3 | 11.54% | 0.84 | -1 | 16.00% | 0.81 | |
| I | 436 | 5.57% | 58 | 13.30% | 0.97 | -2 | 20.09% | 1.01 | |
| A | 162 | 2.07% | 17 | 10.49% | 0.77 | -5 | 17.97% | 0.91 | |
| R | 303 | 3.87% | 37 | 12.21% | 0.89 | 29.31% | 1.48 | ||
| G | 328 | 4.19% | 37 | 11.28% | 0.82 | -8 | 13.21% | 0.67 | |
| E | 427 | 5.45% | 49 | 11.48% | 0.84 | -10 | 23.05% | 1.16 | |
| C | 268 | 3.42% | 24 | 8.96% | * | 0.65 | -13 | 11.20% | 0.57 |
| N | 398 | 5.08% | 42 | 10.55% | 0.77 | 14.79% | 0.75 | ||
| O | 436 | 5.57% | 41 | 9.40% | ** | 0.69 | -19 | 15.15% | 0.77 |
| S | 454 | 5.80% | 42 | 9.25% | ** | 0.67 | -20 | 14.52% | 0.73 |
| Q | 377 | 4.81% | 26 | 6.90% | *** | 0.50 | -26 | 16.84% | 0.85 |
| L | 302 | 3.85% | 13 | 4.30% | *** | 0.31 | -28 | 12.46% | 0.63 |
| T | 555 | 7.08% | 28 | 5.05% | *** | 0.37 | -48 | 9.69% | 0.49 |
- Mark as New
- Bookmark
- Subscribe
- Mute
- RSS Feed
- Permalink
- Report Inappropriate Content
Hi:
If you define EXCESS as an ORDER, then the repetitious display of values will be suppressed. For example, this code:
data class;
set sashelp.class;
** make some people the same height;
if name in ('Barbara', 'Judy', 'Carol','Henry', 'Jeffrey')
then height = 67.5;
run;
proc report data=class nowd;
title '1) Default Behavior';
column sex height weight name;
define sex / order;
define height / order descending;
define weight / display;
define name / display;
run;
proc report data=class nowd;
title '2) Changed Behavior using a COMPUTEd item';
column sex height showht weight name;
define sex / order;
define height / order descending;
define showht / computed;
define weight / display;
define name / display;
compute showht;
if height ne . then do;
holdit = height;
showht = height;
end;
else if height = . then showht=holdit;
endcomp;
run;
Produces these results:
Default:
Using Compute Block:
- Mark as New
- Bookmark
- Subscribe
- Mute
- RSS Feed
- Permalink
- Report Inappropriate Content
Cynthia,
I'll have to try that when I'm back at my desk in the morning.
Marc

- Mark as New
- Bookmark
- Subscribe
- Mute
- RSS Feed
- Permalink
- Report Inappropriate Content
That is what ORDER is DESIGNED to do.
proc report data=sashelp.class;
where age < 13 ;
column age name ;
define age / order ;
run;
Age Name
11 Joyce
Thomas
12 James
Jane
John
Louise
Robert
Why not just use PROC SORT to set the data in right order?
.
- Mark as New
- Bookmark
- Subscribe
- Mute
- RSS Feed
- Permalink
- Report Inappropriate Content
Tom,
Unfortunately, I have many tables with the same issue, as I am actually analyzing one variable in many different ways, and I was looking for a way to streamline my code as opposed to a series of PROC SORTs.
Marc
- Mark as New
- Bookmark
- Subscribe
- Mute
- RSS Feed
- Permalink
- Report Inappropriate Content
Hi:
My code example shows how to work around the issue of using EXCESS as an ORDER item on the report. I posted the code and screen shots. I think you want the second example.
cynthia
- Mark as New
- Bookmark
- Subscribe
- Mute
- RSS Feed
- Permalink
- Report Inappropriate Content
That's what i went for, and it worked like a charm. THANKS!

Don't miss out on SAS Innovate - Register now for the FREE Livestream!
Can't make it to Vegas? No problem! Watch our general sessions LIVE or on-demand starting April 17th. Hear from SAS execs, best-selling author Adam Grant, Hot Ones host Sean Evans, top tech journalist Kara Swisher, AI expert Cassie Kozyrkov, and the mind-blowing dance crew iLuminate! Plus, get access to over 20 breakout sessions.
Learn how use the CAT functions in SAS to join values from multiple variables into a single value.

Find more tutorials on the SAS Users YouTube channel.
 Click image to register for webinar
Classroom Training Available!
Select SAS Training centers are offering in-person courses. View upcoming courses for:
-
8 replies
-
07-22-2015 03:19 PM
-
1521 views
-
5 likes
-
4 in conversation
-
