- Home
- /
- Programming
- /
- ODS Reports
- /
- Re: Bar chart in SAS EG 7.1
- RSS Feed
- Mark Topic as New
- Mark Topic as Read
- Float this Topic for Current User
- Bookmark
- Subscribe
- Mute
- Printer Friendly Page

- Mark as New
- Bookmark
- Subscribe
- Mute
- RSS Feed
- Permalink
- Report Inappropriate Content
I tried to create a bar chart (click on the dataset->Graph->Bar Chart) in SAS EG 7.1 but I'm unable to produce the bar chart in SAS as good as in MS Excel.
Any possibilities to produce the bar chart in EG as similar to the attachment which I did in Excel 2010.
Thanks in advance for your inputs.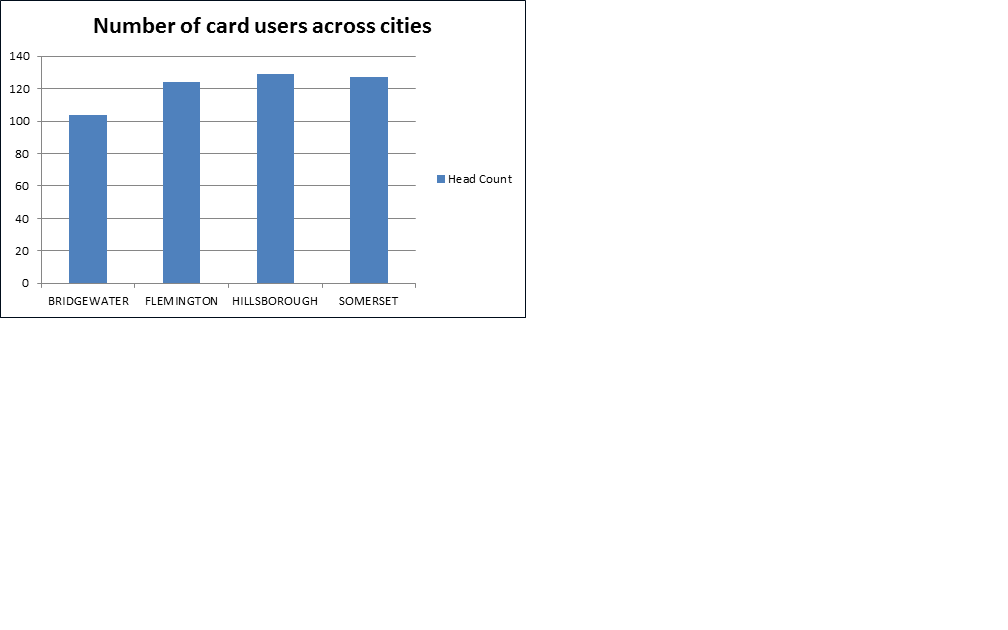

- Mark as New
- Bookmark
- Subscribe
- Mute
- RSS Feed
- Permalink
- Report Inappropriate Content
Hi,
Well, I dont use EG so cant comment specifically on the functionality, although a Google search had many help documents:
http://analytics.ncsu.edu/sesug/2009/HOW007.Thompson.pdf
Its a matter of learning Graph Template language and coding, you can then do most things with graphs. For help learning that, have a look through this blog:

- Mark as New
- Bookmark
- Subscribe
- Mute
- RSS Feed
- Permalink
- Report Inappropriate Content
 Hi:
Hi:
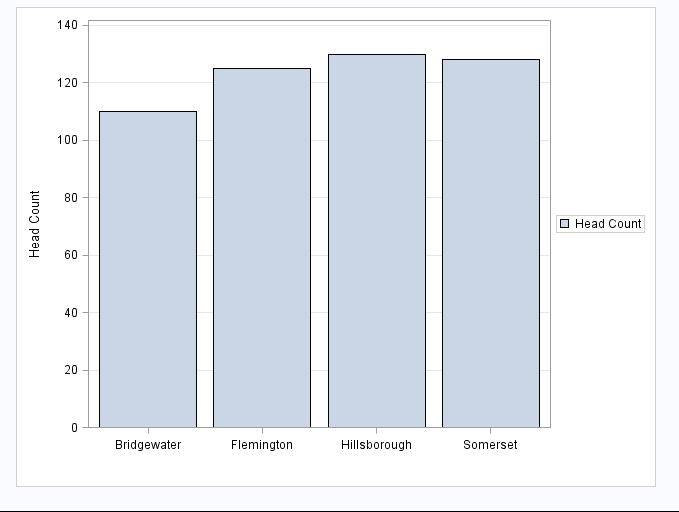
You don't really need GTL for this simple bar chart. The SGPLOT procedure with the VBAR statement will do it. The KEYLEGEND statement gives you a chance to position the legend outside.
Cynthia
data headcount;
length city $12;
infile datalines;
input City $ Headcount;
label headcount='Head Count';
return;
datalines;
Bridgewater 110
Flemington 125
Hillsborough 130
Somerset 128
;
run;
proc sgplot data=headcount;
vbar city / response=headcount name='HC';
xaxis label=' ';
yaxis values=(0 to 140 by 20) label='Head Count' grid;
keylegend 'HC' / location=outside position=right ;
run;
(Note: I will post a screen shot when able to)
- Mark as New
- Bookmark
- Subscribe
- Mute
- RSS Feed
- Permalink
- Report Inappropriate Content
Thanks a ton.
Can't we do this with a simple drag & drop like I did earlier?
I tried to create a bar chart (click on the dataset->Graph->Bar Chart) in SAS EG 7.1
- Mark as New
- Bookmark
- Subscribe
- Mute
- RSS Feed
- Permalink
- Report Inappropriate Content
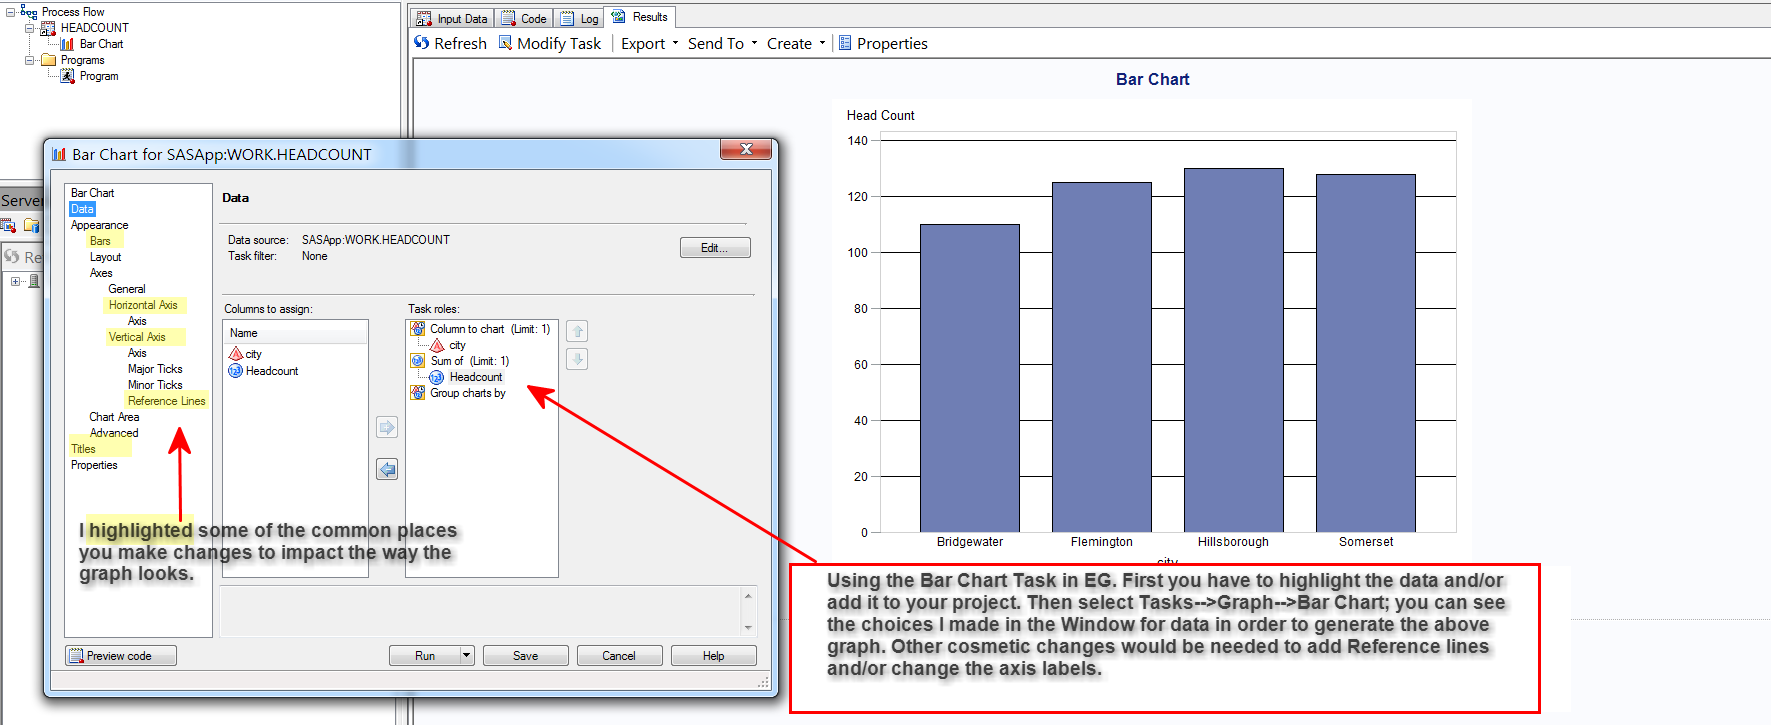
Hi:
I thought you already knew how to create a Bar Chart in EG and wanted an alternative. Depending on what exactly you mean by "as good as in MS Excel" you may or may not have to use code. For example, I produced the screenshot below using the Graph Task in EG (after I ran a program to make the HEADCOUNT data).
cynthia

- Mark as New
- Bookmark
- Subscribe
- Mute
- RSS Feed
- Permalink
- Report Inappropriate Content
Post under SAS EG instead of Graphs perhaps?
Code will always be more powerful than GUI.
You can check if EG has something called SGDesign which is available in SAS Base to customize graphs afterwards, which is point and click.
.jpg")
Catch up on SAS Innovate 2026
Nearly 200 sessions are now available on demand with the SAS Innovate Digital Pass.
Explore Now →Learn how use the CAT functions in SAS to join values from multiple variables into a single value.

Find more tutorials on the SAS Users YouTube channel.
SAS Training: Just a Click Away
Ready to level-up your skills? Choose your own adventure.
-
5 replies
-
03-05-2015 05:45 AM
-
4342 views
-
6 likes
-
4 in conversation
-
