- Home
- /
- Programming
- /
- Graphics
- /
- proc sgplot width of the labels
- RSS Feed
- Mark Topic as New
- Mark Topic as Read
- Float this Topic for Current User
- Bookmark
- Subscribe
- Mute
- Printer Friendly Page

- Mark as New
- Bookmark
- Subscribe
- Mute
- RSS Feed
- Permalink
- Report Inappropriate Content
Hi, everbody!
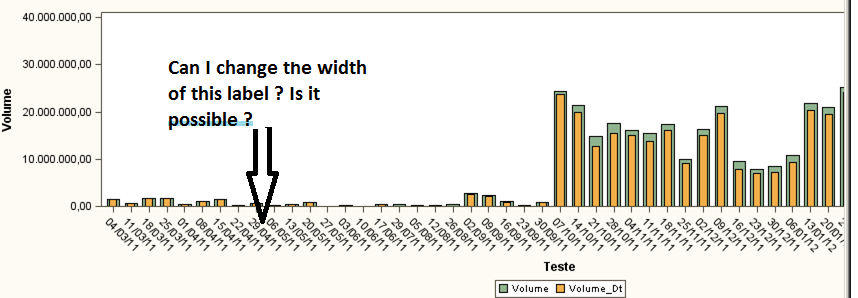
I'm using the proc sgplot and trying to control de width of the label (as you can see in the image).
How can I change the width of the xaxis ?
My code:
graphics on / height=3in width=10.5in noborder;
proc sgplot data=tmpgrafico;
vbar Teste / response=Volume legendlabel="Volume" barwidth=0.7;
vbar Teste / response=Volume_Dt legendlabel="Volume_Dt" barwidth=0.4;
yaxis label='Volume';
run;
tk's in advantage....

- Mark as New
- Bookmark
- Subscribe
- Mute
- RSS Feed
- Permalink
- Report Inappropriate Content
Add
XAXIS FITPOLICY=THIN;
I think it's a v9.3 feature...
PG

- Mark as New
- Bookmark
- Subscribe
- Mute
- RSS Feed
- Permalink
- Report Inappropriate Content
FITPOLICY is in 9.2.3 as well. Other options you might try are STAGGER, STAGGERROTATE, STAGGERTHIN, ROTATETHIN
The format associated with the X axis variable controls what is attempted to display. You might try adding Format teste ddmmyyn4. ;
which should have fewer characters but shouldn't show year values so may be problematic for some uses.

- Mark as New
- Bookmark
- Subscribe
- Mute
- RSS Feed
- Permalink
- Report Inappropriate Content
Is there anyway to rotate to 90?
- Mark as New
- Bookmark
- Subscribe
- Mute
- RSS Feed
- Permalink
- Report Inappropriate Content
As far as I know (up to version 9.3 anyway) you cannot rotate to 90 degrees in SG graphics. You can however in SAS/GRAPH graphics, if you define an axis with the VALUE option and the ANGLE suboption. I find it very awkward to use.
What you might also try in SG graphics is to increase the image resolution with option IMAGE_DPI=300 on your ODS LISTING or ODS HTML statement. This has for side effect to decrease the size of all text strings on the graph. - PG

- Mark as New
- Bookmark
- Subscribe
- Mute
- RSS Feed
- Permalink
- Report Inappropriate Content
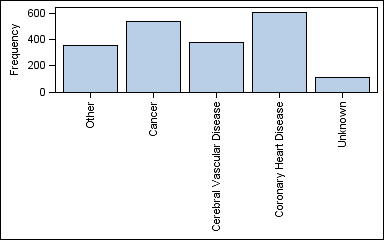
Not sure what you mean by "Change the width of this label". If you want to change the font size of the tick values, you can do that using valueattrs. Vertical tick values are supported at SAS 9.4 in GTL (see example below). In your case, with so many tick values, you could try two other possibilities.
- Use a horizontal bar chart, so the date values are on the Y axis.
- If this is really a time axis, use a time axis with needle plots.
.jpg")
Catch up on SAS Innovate 2026
Nearly 200 sessions are now available on demand in the Innovate Hub.
Watch Now →Learn how use the CAT functions in SAS to join values from multiple variables into a single value.

Find more tutorials on the SAS Users YouTube channel.
SAS Training: Just a Click Away
Ready to level-up your skills? Choose your own adventure.
-
5 replies
-
05-04-2012 11:39 AM
-
4606 views
-
6 likes
-
5 in conversation
-
