- Home
- /
- Programming
- /
- Graphics
- /
- Re: Proc GChart does not render a user-defined PICTURE format
- RSS Feed
- Mark Topic as New
- Mark Topic as Read
- Float this Topic for Current User
- Bookmark
- Subscribe
- Mute
- Printer Friendly Page
- Mark as New
- Bookmark
- Subscribe
- Mute
- RSS Feed
- Permalink
- Report Inappropriate Content
Hi,
(Using SAS 9.3 (TS1M1) via SAS Enterprise Guide 5.100.0.12019) (64-bit) on Windows 7 Pro)
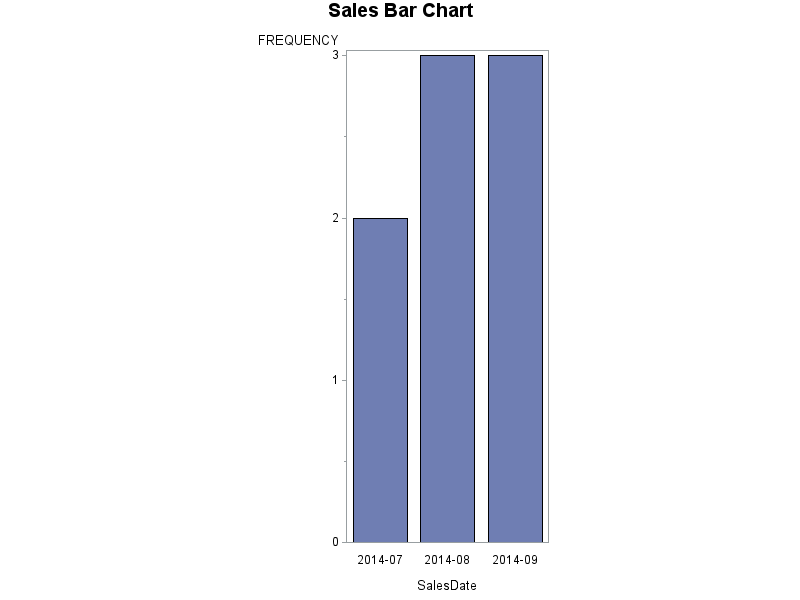
I would like make use of a user defined PICTURE format to form the column labels in a bar chart. I want my columns to be labelled in <yyyy>-<mm> format, such as 2014-07 for any event occurring in Jul-2014. However, when I run PROC GChart out to any of main ODS destinations and using any Graph Format setting (ActiveX, PNG, GIF etc.), the results are not what I expected.
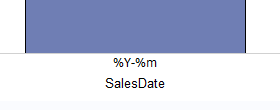
For example, when using ODS destination of HTML and Graph Format of ActiveX, my chart shows a single column with a label that looks like this snippet shows:

Just one big column, where I expected one column per <yyyy>-<mm> combination in my data, and, the label is simply the text of the directives comprising my PICTURE format, whereas I was hoping for 2014-07, 2014-08, 2014-09 etc.
However, when I run the same code out to the ODS SAS Report destination, I get three columns, which is great, but the columns are labelled like this snippet shows, which is not so great:

The SASLOG shows a single warning as:
WARNING: The intervals on the axis labeled SalesDate are not evenly spaced.
however, in this case I do not think that this is material.
There is a currently unanswered SAS Communities posting that raises similar behaviour but that was concerning the Graph Template Language () , whereas this is bog standard SAS and Proc GChart and the trail went cold on that other posting in 2011.
I have put together a simple set of SAS code to show the definition of the PICTURE format, proof that the format works OK when used to format a value in the SASLOG with a PUT statement and then the Proc GChart code that I am using. If anyone can spot what I am doing wrong here I would appreciate some assistance. I know that there are a million workarounds for using dates in SAS/Graph, but in this case I know that it should work and I want to keep my date values as proper date values, not convert them to character.
My sample code is shown below. The two FORMAT statements in the final Proc CGhart can be flipped around to show that, when using a built-in SAS format (YYMON8.), the columns group correctly and are labelled correctly. However using the user-defined PICTURE format DATE_GROUPING. the columns do not behave as I expected them to.
Cheers,
Downunder Dave
Welllington.
Options LINESIZE=145;
*********************************************************************************;
*Create a custom Picture format to represent date values as <yyyy>-<mm> ;
*e.g. 2014-07 for any date falling in July 2014. ;
*********************************************************************************;
Proc Format Library=WORK;
Picture Date_Grouping Low-High= '%Y-%0m' (DataType=DATE);
Run;
*********************************************************************************;
*Prove that it works with some sample data.... ;
*********************************************************************************;
Data Sales_Details;
Input SalesDate Date9.;
Put SalesDate=Date9. SalesDate=Date_Grouping9.;
Datalines;
04Jul2014
13Jul2014
28Aug2014
11Aug2014
15Aug2014
06Sep2014
06Sep2014
06Sep2014
;
Run;
*********************************************************************************;
*Create a simple bar chart. ;
*********************************************************************************;
Axis1 STYLE=1 WIDTH=1 MINOR= (NUMBER=1);
Axis2 STYLE=1 WIDTH=1;
Title1 "Sales Bar Chart";
Proc GChart Data=Work.Sales_Details;
VBAR SalesDate / CLIPREF FRAME DISCRETE TYPE=FREQ COUTLINE=BLACK RAXIS=AXIS1 MAXIS=AXIS2;
/* Format SalesDate YYMON8.;*/
Format SalesDate Date_Grouping9.;
Run;
- Mark as New
- Bookmark
- Subscribe
- Mute
- RSS Feed
- Permalink
- Report Inappropriate Content
I don't know the answer for PICTURE. However you may be able to use YYMMD built in format which I think is the same style YYYY-MM.
Format SalesDate YYMMD.;
The link to the doc.
SAS(R) 9.3 Formats and Informats: Reference
Message was edited by: data _null_
- Mark as New
- Bookmark
- Subscribe
- Mute
- RSS Feed
- Permalink
- Report Inappropriate Content
Hi DATA _NULL_,
Thanks for the suggestion and you are correct that using the built-in YYMMD7. format in my chart would work.
However, the problem is with PICTURE formats in general. I chose the YYYY-MM format just as an example for this question, whereas I really want to use some of the more exotic features of PICTURE directives to create formats for dates that are not supplied out of the box with SAS.
I am also puzzled as to how the ODS destinations of HTML and SAS Report produce different, but equally unacceptable results.
Thanks anyhow to DATA _NULL_ for your interest and input.
Anyone else out there with some ideas on this one ?
Cheers,
Downunder Dave
Wellington.
- Mark as New
- Bookmark
- Subscribe
- Mute
- RSS Feed
- Permalink
- Report Inappropriate Content
I don't know that picture will ever work in this context. I thought there should be PROBLEM NOTE regarding this but I could not find one. This may be related I don't know 585 - Formats MONNAMEw. and MONTHw. may cause incorrect ordering of MIDPOINTS
Since you have the nasty warning.
WARNING: The intervals on the axis labeled SalesDate are not evenly spaced.
why not "convert" the axis to character and be happy and make SAS happy too.
Picture Date_Grouping other= '%0Y-%0m' (DataType=DATE);
Run;
Data Sales_Details;
Input SalesDate Date9.;
Put SalesDate=Date9. SalesDate=Date_Grouping9.;
Datalines;
04Jul2014
13Jul2014
28Aug2014
11Aug2014
15Aug2014
06Sep2014
06Sep2014
06Sep2014
;
Run;
*count and convert numeric date to formatted character.;
proc summary nway;
class salesDate / mlf;
format salesDate Date_Grouping.;
output out=summary;
run;
proc print;
format _all_;
run;
Axis1 STYLE=1 WIDTH=1 MINOR= (NUMBER=1);
Axis2 STYLE=1 WIDTH=1;
Title1 "Sales Bar Chart";
Proc GChart Data=summary;
VBAR SalesDate / CLIPREF FRAME DISCRETE TYPE=sum sumvar=_FREQ_ COUTLINE=BLACK RAXIS=AXIS1 MAXIS=AXIS2;
label _freq_='Frequency';
Run;
- Mark as New
- Bookmark
- Subscribe
- Mute
- RSS Feed
- Permalink
- Report Inappropriate Content
Device=activex (and java) only have partial support for many of the SAS features, and for that reason I avoid using them.
When I specify device=png, and run your code in DMS sas, I believe I get the correct/expected bar chart...
goptions device=png;
Title1 "Sales Bar Chart";
Proc GChart Data=Work.Sales_Details;
VBAR SalesDate / CLIPREF FRAME DISCRETE TYPE=FREQ
COUTLINE=BLACK RAXIS=AXIS1 MAXIS=AXIS2;
Format SalesDate Date_Grouping9.;
Run;

- Mark as New
- Bookmark
- Subscribe
- Mute
- RSS Feed
- Permalink
- Report Inappropriate Content
Hi Robert and DATA_NULL_,
Thank you each for your useful replies.
It is a shame that something like PICTURE formats appear to be currently unsupported in ActiveX charts as that output format does some nice stuff for the user without too much effort, such as tool tips and letting the end-user pfaff around with the chart to suit their needs.
I have now created an Idea at: https://communities.sas.com/ideas/1699 that might attract some votes and hopefully the attention of SAS R&D.
In the meantime, I will flag this question as Answered.
Robert, I love your SAS/Graph Examples pages, they are really helpful and inspirational (http://robslink.com/SAS/Home.htm).
Cheers,
Downunder Dave
Wellington
Learn how use the CAT functions in SAS to join values from multiple variables into a single value.
Find more tutorials on the SAS Users YouTube channel.
SAS Training: Just a Click Away
Ready to level-up your skills? Choose your own adventure.


