- Home
- /
- Programming
- /
- Graphics
- /
- How to make my graph bars sorted out by descending values?
- RSS Feed
- Mark Topic as New
- Mark Topic as Read
- Float this Topic for Current User
- Bookmark
- Subscribe
- Mute
- Printer Friendly Page
- Mark as New
- Bookmark
- Subscribe
- Mute
- RSS Feed
- Permalink
- Report Inappropriate Content
Hello, I was looking through all discussions but couldn't find a proper answer.
The situation is that I have a bar chart and I cannot find the way to sort it out - descending or ascending.
The code I have is:
Title 'Tasks done table';
proc sgplot data=go.Tasks_done;
vbar Name / response = Total datalabel group = Total GROUPORDER= ASCENDING;
label total = 'Taks'
name = 'Names';
run;
quit;
and table 'Tasks_done' consists of:
Total Name
2000 John
3000 Tom
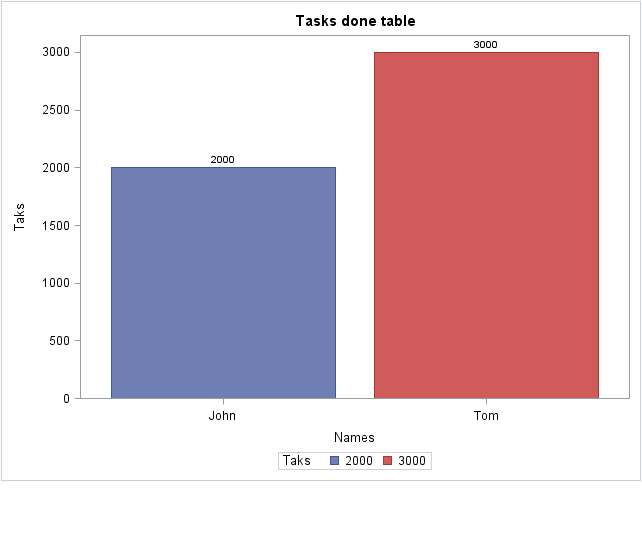
Result is:

So I tried to put Descending or Ascending in code, but I couldn't. Lastly I figured out I need to have group option so then I can use Grouporder = ascending/descending. But my chart is not affected...The I read something about changing axis type (because as I understood I need axis to be 'Discrete' type or something like that.) But when I get deeper, it is getting more and more complicated. Can someone help me out with this?? If possible, could You alter my code or show examples so I could understand it better how to do this thing, cuz I am really stuck for some time with this,
Thank You!
Accepted Solutions
- Mark as New
- Bookmark
- Subscribe
- Mute
- RSS Feed
- Permalink
- Report Inappropriate Content
You could use a XAXIS statement with option REVERSE or option DISCRETEORDER=DATA and sort accordingly. - PG
- Mark as New
- Bookmark
- Subscribe
- Mute
- RSS Feed
- Permalink
- Report Inappropriate Content
You could use a XAXIS statement with option REVERSE or option DISCRETEORDER=DATA and sort accordingly. - PG
Learn how use the CAT functions in SAS to join values from multiple variables into a single value.
Find more tutorials on the SAS Users YouTube channel.
SAS Training: Just a Click Away
Ready to level-up your skills? Choose your own adventure.


