- Home
- /
- Programming
- /
- Graphics
- /
- How to add Insets with superscripts to Classification Panels?
- RSS Feed
- Mark Topic as New
- Mark Topic as Read
- Float this Topic for Current User
- Bookmark
- Subscribe
- Mute
- Printer Friendly Page
- Mark as New
- Bookmark
- Subscribe
- Mute
- RSS Feed
- Permalink
- Report Inappropriate Content
Hi all, I am learning to use the Proc template for classification panels while encountering a problem with "Inset" statement.
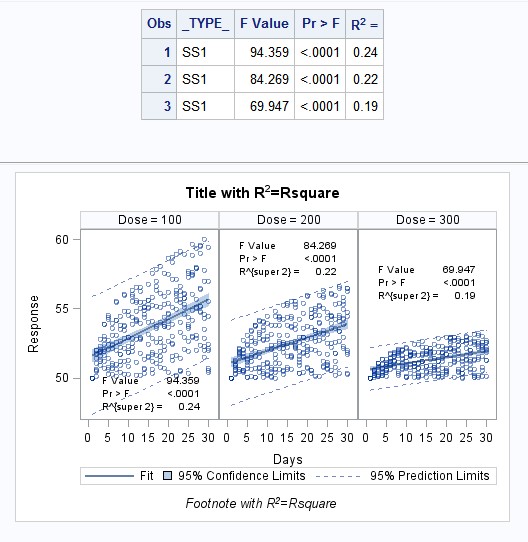
I used the example code SAS(R) 9.3 Graph Template Language: User's Guide and added the R-square to each panel. However, the graph cannot show the superscripts for R2.
Is there a way to show superscripts or Unicode in Inset statement for Classification Panels?
here shows my modified sas codes and ods output, where R2 showed correctly in the ods table and graph title and footnote,
ods escapechar="^";
proc template;
define statgraph panelinset;
begingraph / designwidth=495px designheight=350px;
  entrytitle "Title with R" {sup "2"} "=Rsquare";
  entryfootnote "Footnote with R" {sup "2"} "=Rsquare";
  layout datapanel classvars=(dose) / rows=1
        inset=(F PROB Rsquare)
  insetopts=(autoalign=auto textattrs=(size=7pt)) ;
  layout prototype;
      bandplot    x=days limitupper=uclm limitlower=lclm / name="clm"
                    display=(fill)  fillattrs=GraphConfidence
                    legendlabel="95% Confidence Limits";
      bandplot    x=days limitupper=ucl limitlower=lcl / name="cli"
                    display=(outline) outlineattrs=GraphPredictionLimits
                    legendlabel="95% Prediction Limits";
      seriesplot  x=days y=predicted / name="reg"
                    lineattrs=graphFit legendlabel="Fit";
      scatterplot x=days y=response / primary=true
                    markerattrs=(size=5px) datatransparency=.5;
    endlayout;
    sidebar / align=top;
    endsidebar;
    sidebar / align=bottom;
      discretelegend "reg" "clm" "cli" / across=3;
    endsidebar;
  endlayout;
endgraph;
end;
run;

data trial;
do Dose = 100 to 300 by 100;
  do Days=1 to 30;
   do Subject=1 to 10;
   Response=log(days)*(400-dose)* .01*ranuni(1) + 50;
   output;
   end;
  end;
end;
run;

proc glm data=trial alpha=.05 outstat=outstat ;
  ods output FitStatistics=fit;
  by dose;
  model response=days / p cli clm;
  output out=stats
        lclm=lclm uclm=uclm lcl=lcl ucl=ucl predicted=predicted ;
run; quit;

data outstat2;
merge outstat fit;
by dose;
run;

data inset;
  set outstat2 (keep=F PROB _TYPE_ Rsquare where=(_TYPE_="SS1"));
  label F="F Value " PROB="Pr > F " Rsquare="R^{super 2} = ";
    format F best6. PROB pvalue6.4 Rsquare 4.2;
run;
proc print data=inset label;
run;

data stats2;
  merge stats inset;
run;

proc sgrender data=stats2 template=panelinset;
run;
and ods output, where R2 showed correctly in the ods table and graph title and footnote.

thanks in advance,
Accepted Solutions
- Mark as New
- Bookmark
- Subscribe
- Mute
- RSS Feed
- Permalink
- Report Inappropriate Content
Hi
I tried your code using UNICODE version of SAS and works OK. You have to change your references to unicode characters to the actual character you want. (Character map is handy for this).
S
- Mark as New
- Bookmark
- Subscribe
- Mute
- RSS Feed
- Permalink
- Report Inappropriate Content
There is an issue with combining unicode defined within GTL and unicode defined outside GTL such as in a data step or proc format. They don't seem to play well together. The easiest solution I have found is to run your code under the UNICODE language version of SAS.
R
- Mark as New
- Bookmark
- Subscribe
- Mute
- RSS Feed
- Permalink
- Report Inappropriate Content
Thank you Sticky. I tried your suggestion. However, it doesn't work for me.
May I ask one more question, about how to generate a graph with several rows that show several "response" variables, e.g. response 1, response2..., they have the same category variable (dose) and also x axes.
If it is possible, the graph will like lattice panels. however, classification panels only allow the use of class variables. I found neither LAYOUT DATAPANEL nor LAYOUT DATALATTICE could achieve the purpose.
thanks.
K
- Mark as New
- Bookmark
- Subscribe
- Mute
- RSS Feed
- Permalink
- Report Inappropriate Content
Hi
I tried your code using UNICODE version of SAS and works OK. You have to change your references to unicode characters to the actual character you want. (Character map is handy for this).
S
- Mark as New
- Bookmark
- Subscribe
- Mute
- RSS Feed
- Permalink
- Report Inappropriate Content
Thanks a lot, Sticky, this is the correct answer! I changed the unicode reference "R^{super 2} " to "R² " and finally works good, even in the english version SAS, and I just simply typed in the superscript for 2 on my German keyboard.
Now, I am looking forward to the answer to my second question.
Learn how use the CAT functions in SAS to join values from multiple variables into a single value.
Find more tutorials on the SAS Users YouTube channel.
SAS Training: Just a Click Away
Ready to level-up your skills? Choose your own adventure.


