- Home
- /
- Programming
- /
- Graphics
- /
- Hazard ratio plot
- RSS Feed
- Mark Topic as New
- Mark Topic as Read
- Float this Topic for Current User
- Bookmark
- Subscribe
- Mute
- Printer Friendly Page
- Mark as New
- Bookmark
- Subscribe
- Mute
- RSS Feed
- Permalink
- Report Inappropriate Content
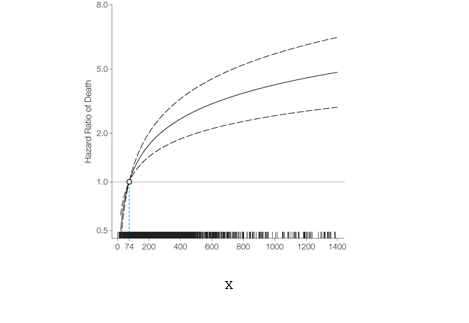
How to do plot of Hazard Ratio vs Covariate X like below plot with 95% band, and reference line?
I am using proc phreg for the cox regression model using X as predictor variable, with all the other covariates adjustment x1, x2, x3... thank you.

- Mark as New
- Bookmark
- Subscribe
- Mute
- RSS Feed
- Permalink
- Report Inappropriate Content
If you have outputted the corresponding dataset then you could use SGPLOT with three SERIES statements to obtain the Hazard Ratio vs Covariate and the 95% confidence limits.
You could also plot the reference line using the REFLINE statment.
Have you also checked to see if you can get a plot similar to the one you want directly from using the PROC PHREG procedure?
Learn how use the CAT functions in SAS to join values from multiple variables into a single value.
Find more tutorials on the SAS Users YouTube channel.
SAS Training: Just a Click Away
Ready to level-up your skills? Choose your own adventure.


