- Home
- /
- Programming
- /
- Graphics
- /
- GTL needleplot groupdisplay in SAS 9.3
- RSS Feed
- Mark Topic as New
- Mark Topic as Read
- Float this Topic for Current User
- Bookmark
- Subscribe
- Mute
- Printer Friendly Page

- Mark as New
- Bookmark
- Subscribe
- Mute
- RSS Feed
- Permalink
- Report Inappropriate Content
Hi!
I would like to create a graph as follow by using the groupdisplay tag.
Is this possible and how?
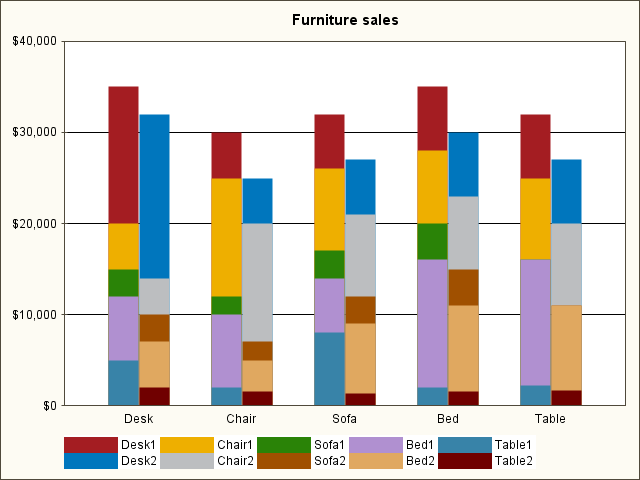
And if I change gtl tag to barchart would this be possible?
Documentation info can be found here:
Thanks in advance,
Best regards
Paolo Santin
Accepted Solutions

- Mark as New
- Bookmark
- Subscribe
- Mute
- RSS Feed
- Permalink
- Report Inappropriate Content
NEEDLEPLOT does not allow stacked groups. The only benefit I see of using needle instead of barchartis that you can have an interval X axis, since bar chart always makes the axis discrete. If that is your aim, you can use the HIGHLOWPLOT with default TYPE=LINE. You will have to compute the high and low values yourself based on the stacking you want. You can also use the HIGHLOWBAR with TYPE=BAR with a linear axis. This will give you the "bar" look with fills and outlines, but these type of plot (HighLowPlot or NeedlePlot) do not summarize your data. You can also do this in SGPLOT.
Another alternative is to use the VECTORPLOT.
- Mark as New
- Bookmark
- Subscribe
- Mute
- RSS Feed
- Permalink
- Report Inappropriate Content
Yes, you can do this using GTL BARCHART. The bar chart can have only ONE group role which can either be Clustered or Stacked. So in your case split your data into two response columns, one for the "1" data and one for the "2" data. Then, use a stacked bar chart.for the "1" values with a negative discrete offset. Overlay another stacked bar chart for the "2" with positive discrete offset. Set bar widths to 0.5 or less.
- Mark as New
- Bookmark
- Subscribe
- Mute
- RSS Feed
- Permalink
- Report Inappropriate Content
Hi Sanjay and thank you for your answer!
I wonder if it's possible to do the same thing with the needleplot tag instead.
I should use the groupdisplay option but I couldn't make it work.
Do you know how to obtain such a result?
Thank you in advance!
Br,
Paolo
- Mark as New
- Bookmark
- Subscribe
- Mute
- RSS Feed
- Permalink
- Report Inappropriate Content
NEEDLEPLOT does not allow stacked groups. The only benefit I see of using needle instead of barchartis that you can have an interval X axis, since bar chart always makes the axis discrete. If that is your aim, you can use the HIGHLOWPLOT with default TYPE=LINE. You will have to compute the high and low values yourself based on the stacking you want. You can also use the HIGHLOWBAR with TYPE=BAR with a linear axis. This will give you the "bar" look with fills and outlines, but these type of plot (HighLowPlot or NeedlePlot) do not summarize your data. You can also do this in SGPLOT.
Another alternative is to use the VECTORPLOT.
- Mark as New
- Bookmark
- Subscribe
- Mute
- RSS Feed
- Permalink
- Report Inappropriate Content
Thank you very much!
.jpg")
Catch up on SAS Innovate 2026
Nearly 200 sessions are now available on demand in the Innovate Hub.
Watch Now →Learn how use the CAT functions in SAS to join values from multiple variables into a single value.

Find more tutorials on the SAS Users YouTube channel.
SAS Training: Just a Click Away
Ready to level-up your skills? Choose your own adventure.
-
4 replies
-
11-08-2012 07:47 AM
-
4064 views
-
3 likes
-
2 in conversation
-
