- Home
- /
- Programming
- /
- Graphics
- /
- Fun w/ODS Graphics: Stacked Bar Chart of Women's 4x100m Freestyle Swim...
- RSS Feed
- Mark Topic as New
- Mark Topic as Read
- Float this Topic for Current User
- Bookmark
- Subscribe
- Mute
- Printer Friendly Page
- Mark as New
- Bookmark
- Subscribe
- Mute
- RSS Feed
- Permalink
- Report Inappropriate Content
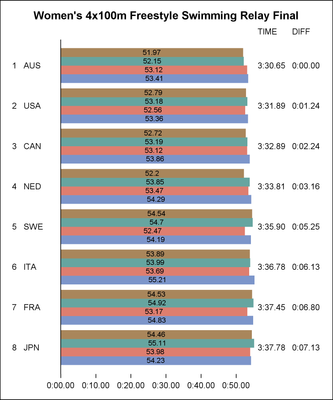
OK, finally got around to downloading the latest-and-greatest SAS University Edition to replace my expired version, and decided to take it for a spin by charting the results of Saturday's Women's 4x100m Freestyle Swimming Relay Final. If it looks familiar to some, that may be because it's pretty much a horizontal take on the vertical Stacked Bar Chart with Segment Labels from Sanjay Matange's Graphically Speaking blog post.
* Read in data for Women's 4x100m Freestyle Swimming Relay Final;

data swimmers(keep=rank lane abbr team swimmer leg reactiontime meter50time time low high mid);
length name team swimmer : $ 30 abbr $ 3;
retain team abbr ' '; retain rank lane low high;
infile cards firstobs=3 missover dlm="," dsd;
input irank ilane name reactiontime : hhmmss. meter50time : hhmmss. time : hhmmss.;
if irank^=. then do; * Does line contain team info?;
  rank=irank;
  lane=ilane;
  abbr=substr(name,1,3);
  team=substr(name,4);
  leg=0;
  low=0;
  high=0;
  delete;
  end;
swimmer=trim(name)||'*'||compress(put(time,mmss7.2),' '); * Append time to swimmer's name;
leg+1;
high+time;
mid=low+(high-low)/2; * Compute midpoint of swimmer's time (used to center name/time);
output;
low=high;
cards;
Source: https://www.rio2016.com/en/swimming-womens-4-x-100m-freestyle-relay-final
RANK,LANE,TEAM,REACTION TIME,50M,TIME
1,4,AUSAustralia,,,03:30.7
,,MCKEON Emma,0.76,25.67,53.41
,,ELMSLIE Brittany,0.21,25.59,53.12
,,CAMPBELL Bronte,0.22,24.47,52.15
,,CAMPBELL Cate,0.34,24.15,51.97
2,5,USAUnited States,,,03:31.9
,,MANUEL Simone,0.69,25.64,53.36
,,WEITZEIL Abbey,0.21,24.94,52.56
,,VOLLMER Dana,0.21,25.01,53.18
,,LEDECKY Kathleen,0.18,25.39,52.79
3,3,CANCanada,,,03:32.9
,,MAINVILLE Sandrine,0.64,25.85,53.86
,,VAN LANDEGHEM Chantal,0.17,25.23,53.12
,,RUCK Taylor Madison,0.2,25.15,53.19
,,OLEKSIAK Penny,0.13,25.29,52.72
4,2,NEDNetherlands,,,03:33.8
,,STEENBERGEN Marrit,0.86,26.28,54.29
,,HEEMSKERK Femke,0.16,25.06,53.47
,,DEKKER Inge,0.2,25.38,53.85
,,KROMOWIDJOJO Ranomi,0.25,24.73,52.2
5,7,SWESweden,,,03:35.9
,,COLEMAN Michelle,0.74,26.33,54.19
,,SJOSTROM Sarah,0.19,25.36,52.47
,,MARKO-VARGA Ida,0.37,26.29,54.7
,,HANSSON Louise,0.22,26.13,54.54
6,6,ITAItaly,,,03:36.8
,,FERRAIOLI Erika,0.72,26.17,55.21
,,DI PIETRO Silvia,0.17,25.38,53.69
,,PEZZATO Aglaia,0.1,25.61,53.99
,,PELLEGRINI Federica,0.18,26.02,53.89
7,8,FRAFrance,,,03:37.4
,,GASTALDELLO Beryl,0.68,26.58,54.83
,,BONNET Charlotte,0.13,25.57,53.17
,,CINI Mathilde,0.14,26.29,54.92
,,SANTAMANS Anna,0.13,25.89,54.53
8,1,JPNJapan,,,03:37.8
,,UCHIDA Miki,0.7,26.3,54.23
,,IKEE Rikako,0.41,25.79,53.98
,,YAMAGUCHI Misaki,0.23,26.27,55.11
,,MATSUMOTO Yayoi,0.31,26.12,54.46
;

* Compute team and winning times, append to swimmer-level data;

proc sql;
create table teamtimes as select lane, sum(time) as teamtime from swimmers group by 1;
create table swimmers2plot as
select s.*, t.teamtime, w.winningtime, t.teamtime-w.winningtime as timebehind
from swimmers s, teamtimes t, (select min(teamtime) as winningtime from teamtimes) w where s.lane=t.lane;

* Chart data - highlow and text plot combo;

ods listing image_dpi=300 gpath='/folders/myfolders';
ods graphics on / reset antialias width=11in height=4.5in imagename="swimmers";
proc sgplot data=swimmers2plot noautolegend noborder;
title "Women's 4x100m Freestyle Swimming Relay Final";
highlow y=rank low=low high=high / group=leg type=bar barwidth=1 fill nooutline;
text y=rank x=mid text=swimmer / textattrs=(weight=bold color=white size=8pt)
                                 splitpolicy=splitalways splitjustify=center splitchar="*";
yaxis display=(nolabel noticks novalues noline) reverse;
xaxis offsetmin=0 offsetmax=0 display=(nolabel noline) tickvalueformat=mmss8.2 valueattrs=(size=8pt);
yaxistable rank abbr / stat=mean nolabel position=left valueattrs=(size=8pt);
yaxistable teamtime / title="TIME" titleattrs=(size=8pt) stat=mean nolabel position=right valueattrs=(size=8pt);
yaxistable timebehind / title="DIFF" titleattrs=(size=8pt) stat=mean nolabel position=right valueattrs=(size=8pt);
refline winningtime / axis=x lineattrs=(pattern=dot color=white); * Winning time;
refline 1.5 2.5 3.5 4.5 5.5 6.5 7.5 / axis=y lineattrs=(pattern=dash thickness=3.5pt color=white); * "Lane markers";
format teamtime timebehind winningtime mmss8.2;
run;
- Mark as New
- Bookmark
- Subscribe
- Mute
- RSS Feed
- Permalink
- Report Inappropriate Content
Wow -- this really shows you how close these times are, especially in the first couple of legs. And it shows the importance of the anchor leg (final swimmer).
- Mark as New
- Bookmark
- Subscribe
- Mute
- RSS Feed
- Permalink
- Report Inappropriate Content
Awesome. Horizontal bar is more appropriate for this example. Clearly, Campbell made the difference in the anchor leg.
Also helps to see the data clustered by leg to see each contribution. We could add the name of the swimmer, but I took the shortcut. 🙂
- Mark as New
- Bookmark
- Subscribe
- Mute
- RSS Feed
- Permalink
- Report Inappropriate Content
Love these visualizations and not only because it shows the Gold medal Australian swimmers. ![]() I like @tc how your visual also looks like the pool with the lanes, was that something you had in mind?
I like @tc how your visual also looks like the pool with the lanes, was that something you had in mind?
I like your splits comparison chart @Jay54, although I think I'd prefer to see the fastest time figure at the end of the bar group for each split instead.
Nice SASsy #dataviz work!

The 2025 SAS Hackathon has begun!
It's finally time to hack! Remember to visit the SAS Hacker's Hub regularly for news and updates.
Learn how use the CAT functions in SAS to join values from multiple variables into a single value.
Find more tutorials on the SAS Users YouTube channel.
SAS Training: Just a Click Away
Ready to level-up your skills? Choose your own adventure.


