- Home
- /
- Programming
- /
- Graphics
- /
- Create Activex Graphs with all available variables
- RSS Feed
- Mark Topic as New
- Mark Topic as Read
- Float this Topic for Current User
- Bookmark
- Subscribe
- Mute
- Printer Friendly Page

- Mark as New
- Bookmark
- Subscribe
- Mute
- RSS Feed
- Permalink
- Report Inappropriate Content
HI,
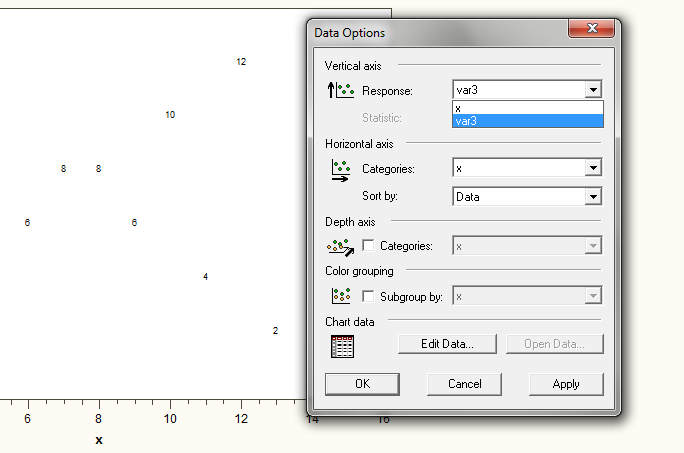
I am trying to create an activex plot that enables me to visualize the relationship between multiple variables. However, I only want two variables to show at a time. To help illustrate my question, please see the example code below. Ideally, the code would create a scatter plot of var3 by x as the default graph. Then, if I were to right click the graph and choose data options, I would be able select var1 or var2 in the Response drop down menu.
Note: Currently, the Response drop down only shows the var3 and x. I have also changed the plot line to (var1 var2 var3)*x/overlay, but then all three responses are plotted against the X and I cannot find a way to "remove" two from the graph.
Thanks in advance!
data testdata;
do x = 1 to 15;
var1 = x;
var2 = -x;
var3 = 7.5 + ((-1)**((mod(x,2)=0)))*(7.5-x);
output;
end;
run;
ods html path="%sysfunc(pathname(work))" file="test.html";
goptions device=activex;
proc gplot data=testdata;
plot var3*x;
run;
ods html close;

- Mark as New
- Bookmark
- Subscribe
- Mute
- RSS Feed
- Permalink
- Report Inappropriate Content
When client-based output is generate, only the data necessary to render the graph is sent to the client. Therefore, you have to find a creative way to send the extra data. One suggestion would be to use the POINTLABEL option to send the extra data and just turn off the data labels when you bring up the graph. The extra variables should now be in your menu. Your code for this approach should look something like the following:
data testdata;
do x = 1 to 15;
var1 = x;
var2 = -x;
var3 = 7.5 + ((-1)**((mod(x,2)=0)))*(7.5-x);
output;
end;
run;
ods html path="%sysfunc(pathname(work))" file="test.html";
goptions device=activex;
symbol1 v=none pointlabel=("#var1:#var2");
proc gplot data=testdata;
plot var3*x;
run;
ods html close;
Hope this helps!
Dan
- Mark as New
- Bookmark
- Subscribe
- Mute
- RSS Feed
- Permalink
- Report Inappropriate Content
HI Dan,
I tried your solution but I did not have var1 and var2 available in the drop down menu. Any thoughts?
.jpg")
Catch up on SAS Innovate 2026
Nearly 200 sessions are now available on demand in the Innovate Hub.
Watch Now →Learn how use the CAT functions in SAS to join values from multiple variables into a single value.

Find more tutorials on the SAS Users YouTube channel.
SAS Training: Just a Click Away
Ready to level-up your skills? Choose your own adventure.
-
2 replies
-
09-24-2013 09:18 AM
-
2369 views
-
0 likes
-
2 in conversation
-
