- Home
- /
- Programming
- /
- Programming
- /
- Use variable label instead of variable name in a graph`
- RSS Feed
- Mark Topic as New
- Mark Topic as Read
- Float this Topic for Current User
- Bookmark
- Subscribe
- Mute
- Printer Friendly Page

- Mark as New
- Bookmark
- Subscribe
- Mute
- RSS Feed
- Permalink
- Report Inappropriate Content
I am using- ods graphics to obtain my graphs, what I can figure out is how to use the variable label instead of the variable name (which is usually kind of cryptic!)!

- Mark as New
- Bookmark
- Subscribe
- Mute
- RSS Feed
- Permalink
- Report Inappropriate Content
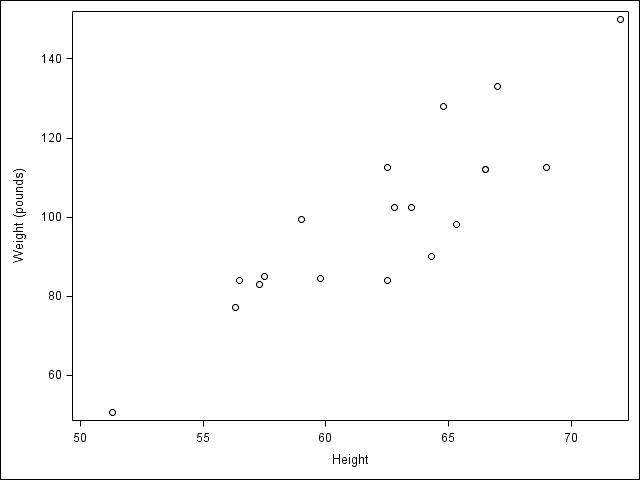
ODS graphics does use variable labels on axes labels:
data class;
set sashelp.class;
label weight="Weight (pounds)";
run;
proc sgplot;
scatter x=height y=weight;
run;
PG
- Mark as New
- Bookmark
- Subscribe
- Mute
- RSS Feed
- Permalink
- Report Inappropriate Content
here is what happens
ods graphics on;
proc logistic data=stage3concurrent plots(only)=oddsratio (type=horizontalstat range=(0,3)) ;
CLASS urban regionvisn yeargroup (ref='2001-2004') EPvsTC stage numsquam;
model EPvsTC (event='Cisplatin and Etoposide')= yeargroup stage numsquam priorhosp age10 poslostweightperc fullhgb fullalb chrlson egfr2 / risklimits lackfit rsquare parmlabel;
units egfr2=10 priorhosp=1 age10=1 poslostweightperc=1 fullhgb=1 fullalb=1 chrlson=1;
run;
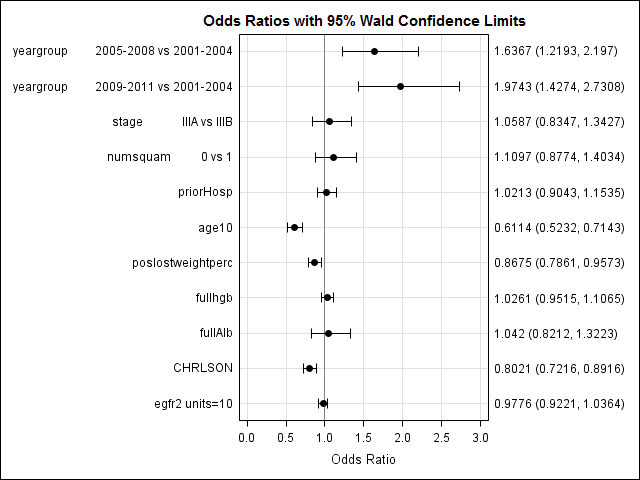
how can a change the labels on the graph to the variable label?

- Mark as New
- Bookmark
- Subscribe
- Mute
- RSS Feed
- Permalink
- Report Inappropriate Content
You'll probably have to modify the template ![]()

Don't miss out on SAS Innovate - Register now for the FREE Livestream!
Can't make it to Vegas? No problem! Watch our general sessions LIVE or on-demand starting April 17th. Hear from SAS execs, best-selling author Adam Grant, Hot Ones host Sean Evans, top tech journalist Kara Swisher, AI expert Cassie Kozyrkov, and the mind-blowing dance crew iLuminate! Plus, get access to over 20 breakout sessions.
Learn how use the CAT functions in SAS to join values from multiple variables into a single value.

Find more tutorials on the SAS Users YouTube channel.
 Click image to register for webinar
Classroom Training Available!
Select SAS Training centers are offering in-person courses. View upcoming courses for:
-
3 replies
-
02-28-2014 12:59 PM
-
2927 views
-
0 likes
-
3 in conversation
-
